Join Our Telegram channel to stay up to date on breaking news coverage
Bitcoin (BTC) Price Prediction – June 8
BTC/USD continues to consolidate underneath a $10,000 barrier and on top of critical support $9,700. Whereas, the price range is narrowing which may likely lead to an explosive breakout.
BTC/USD Long-term Trend: Bullish (Daily Chart)
Key levels:
Resistance Levels: $10,600, $10,800, $11,000
Support Levels: $8,800, $8,600, $8,400
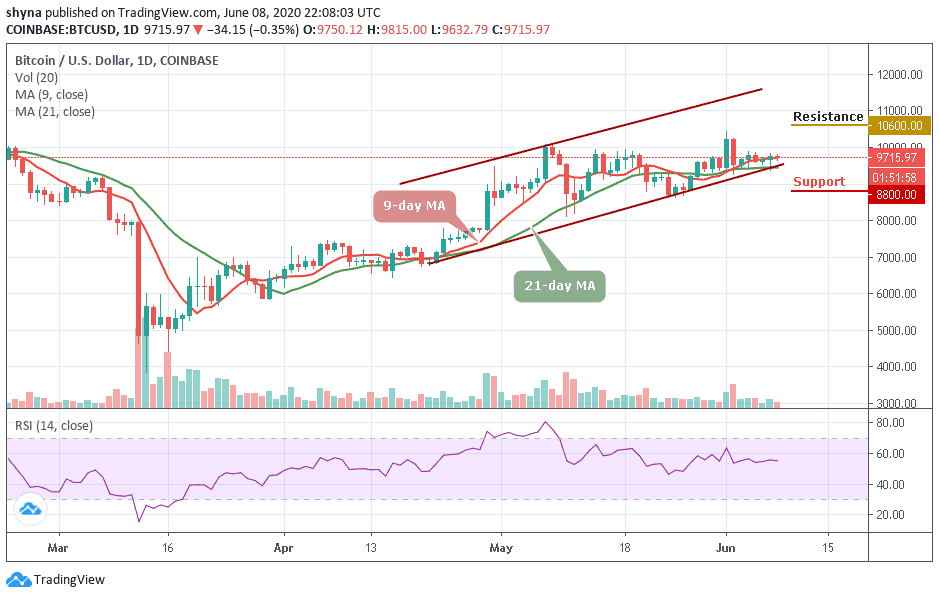
BTC/USD has maintained its price near $9,850 mark from yesterday. Though the coin has been through a few ups and downs, this period, the price has been down with 0.35% in the value. It is likely to retain this bearish vibe in the near-term as the technical indicator moves in the same direction below the 60-level. At the time of writing this, the price of Bitcoin is hovering at $9,715 around the 9-day moving average.
Moreover, the critical support at $9,500 may continue to be tested to the downside as the price consolidates. Looking at the daily chart, failure of the noted support would likely see a channel retest. This area is likely to slow down the correction and serve as a jumping-off ground for another recovery attempt; however, if it is out of the way, the support level of $8,800, $8,600, and $8,400 may come into focus.
Meanwhile, BTC/USD recovers above $9,643 but the resistance at $9,700 still stands in the way of movements to $9,800. In the meantime, Bitcoin is trading at $9,715 amid a building bullish momentum. However, BTC/USD is still fighting to correct the subtle bearish movement and the bullish trend coupled with the right volume and high volatility levels are the right ingredient for the recovery to $10,000 in other to resume its upward movement towards $10,600, $10,800, and $11,000 resistance levels.
BTC/USD Medium-Term Trend: Ranging (4H Chart)
Checking the 4-Hour chart, BTC/USD trades within the range of $9,834 to $9,460. Nevertheless, Bitcoin has not yet slipped below $9,200 and still in the loop of breaking or making a bounce back. BTC price hovers around $9,722 and may take time to persistently trade above $10,000. The upward movement may be able to near the $9,900 and $10,100 resistance level if the bulls regroup.
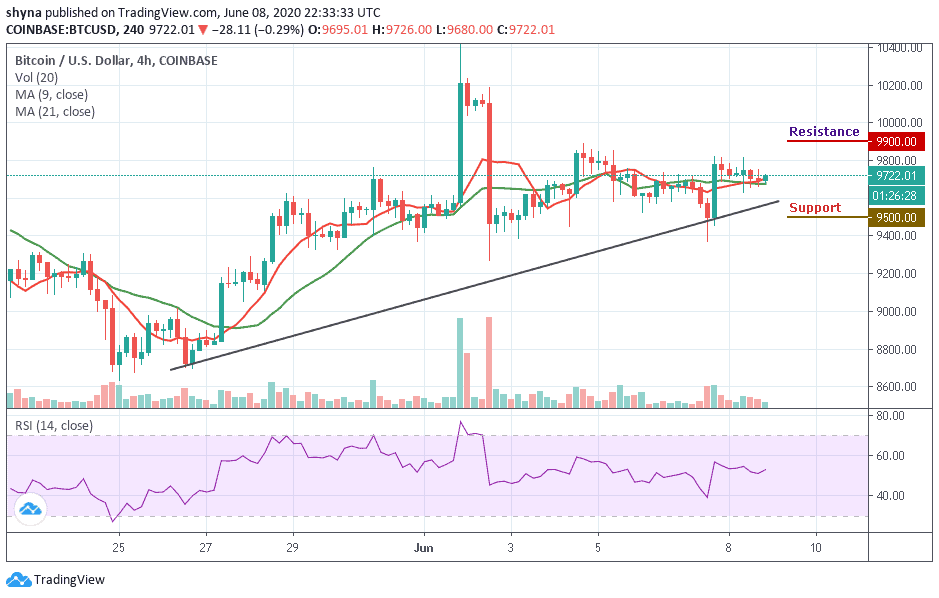
However, on the downside, the price may likely fall below $9,600 if the bears step back into the market, a further movement could test the critical support at $9,500 level. Technically, Bitcoin is currently moving in sideways while the RSI (14) moves in the same direction, indicating an indecisive in the market movement.
Please note: Insidebitcoins.com is not a financial advisor. Do your research before investing your funds in any financial asset or presented product or event. We are not responsible for your investing results.
Join Our Telegram channel to stay up to date on breaking news coverage