Join Our Telegram channel to stay up to date on breaking news coverage
Bitcoin (BTC) Price Prediction – June 27, 2020
BTC/USD pair has recovered from its recent breakdown on June 25 after it plunged to $9,011 low. However, the recovery has not been over as buyers continue to struggle at the $9,000 lower region. The sideways trading between $9,000 and $10,000 will resume once BTC recovers fully from the lower region.
Key Levels:
Resistance Levels: $10,000, $11, 000, $12,000
Support Levels: $7,000, $6,000, $5,000
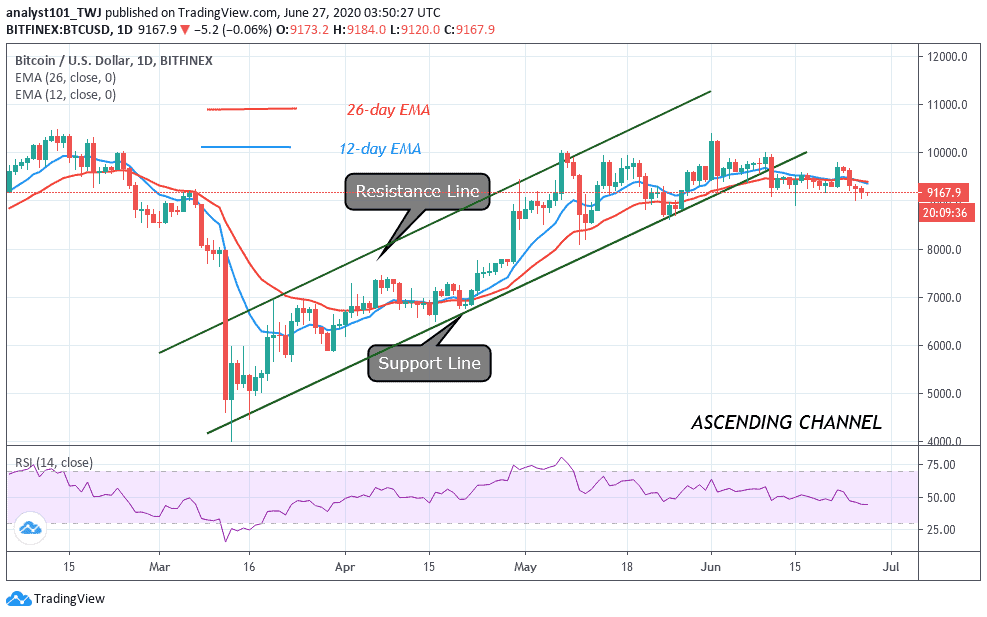
Bitcoin is now hovering in the lower region of $9,000. The bears have retested the $9,100 and $9,050 lows after the initial fall. Bitcoin is showing a sign of weakness as it hovers around the lower region of $9,000. Analysts believe that this sideways trading will eventually lead to a downward movement of prices. The king coin has risen to $9,100 at the time of writing. In a couple of days, if BTC rises to $9,400, it is assumed that the coin will resume the upside range trading. In the upside range trading, price fluctuates between $9,300 and $9,800 to retest the $10,000 overhead resistance.
Once the bulls clear the $9,800 resistance, price will accelerate to retest the major resistance. In the meantime, price is fluctuating between $9,000 and $9,200. Bitcoin will likely resume a downward move if the current support fails to hold. On the downside, if the bears break below $9,050, it will signal the resumption of the downtrend. At the moment, the bulls and bears are in a price tussle in the lower region of $9,000.The Relative Strength Index period 14 is at level 45. It indicates that the market is in the downtrend zone and below the centerline 50.
BTC/USD Medium-term Trend: Bullish (4-Hour Chart)
On the 4 hour chart, the bulls are defending the lower region of $9,000 as the downward move was repelled on two occasions. A Fibonacci tool is used to determine the current bullish impulses.
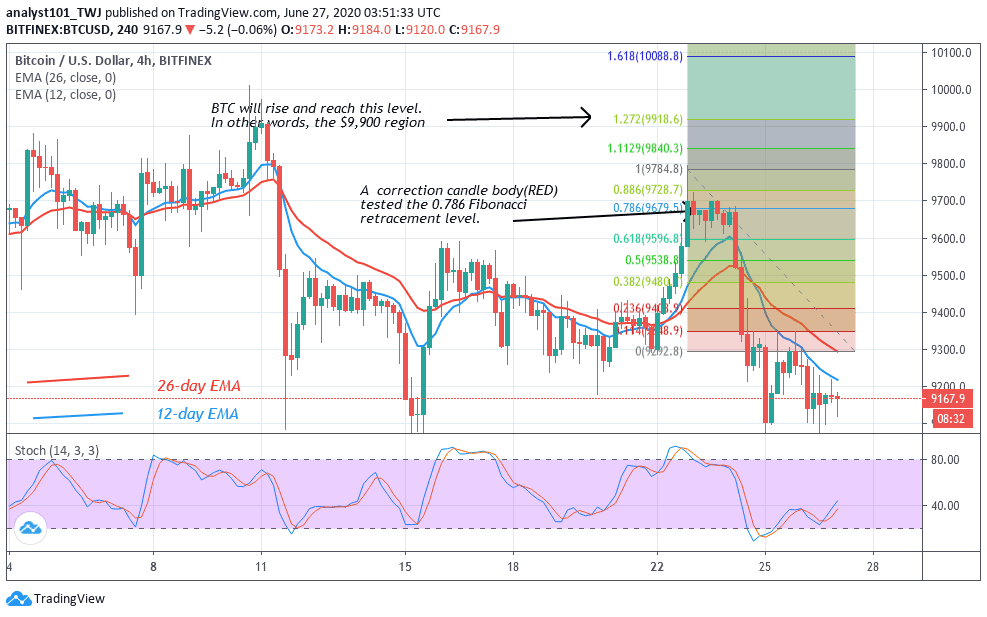
A correction candlestick body tested the 0.786 Fibonacci retracement level. This indicates that Bitcoin is likely to rise to 1.272 Fibonacci extension level. This upward move is in the $9,900 region. Thereafter, price will reverse to 0.786 Fibonacci retracement level. In other words, price falls and resumes consolidation above $9,600. The king coin is above 25% range of the daily stochastic. Presently, it is in a bullish momentum.
Join Our Telegram channel to stay up to date on breaking news coverage