Join Our Telegram channel to stay up to date on breaking news coverage
XRP Price Prediction – June 26
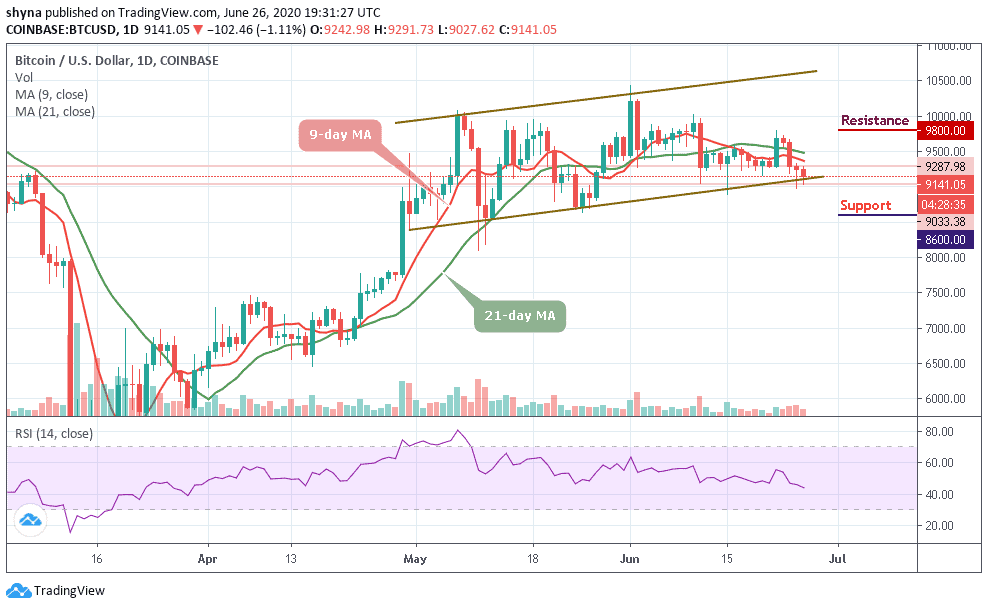
Since June 2, Ripple (XRP) has been trading in a downtrend while the bulls are making a serious effort to protect the support.
XRP/USD Market
Key Levels:
Resistance levels: $0.195, $0.200, $0.205
Support levels: $0.170, $0.165, $0.160
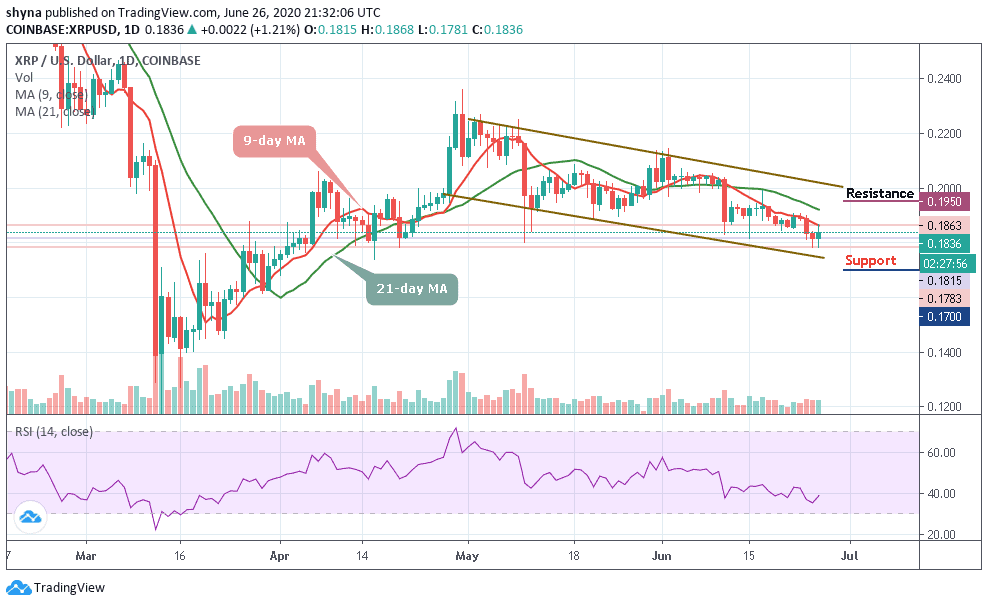
XRP/USD is following a downtrend below the $0.190 support level. The price is currently trading around the $0.183 support and it could continue to decline. Meanwhile, this week’s crucial bearish trend line is intact near $0.180 on the daily chart. XRP/USD price remains at a risk of more losses below the $0.175 support.
Moreover, the Ripple (XRP) price continues to demonstrate a sign of weakness across its markets. Similarly, the market has seen a sharp decline breaking the $0.180 support level and settled well below the 9-day and 21-day moving averages within the descending channel.
Nevertheless, if the $0.180 support can suppress the on-going selling pressure, we may expect the price to bounce back. For now, the nearest resistance for the market is $0.195, $0.200, and $0.205. As it appeared on the daily chart, there’s no sign of a decisive move at the moment.
However, if the $0.175 support gets weak, a price break-down may occur as the bears may find a new monthly low at $0.170, $0.165, and $0.160 support levels. The RSI (14) is now facing the upward movement, suggesting more bullish signals.
Compared with Bitcoin, the pair is consolidating within the channel and moving around the 9-day and 21-day moving averages. Meanwhile, the buyers have been trying to push the price above the moving averages while the bullish continuation may take it to the resistance levels of 2100 SAT and above.
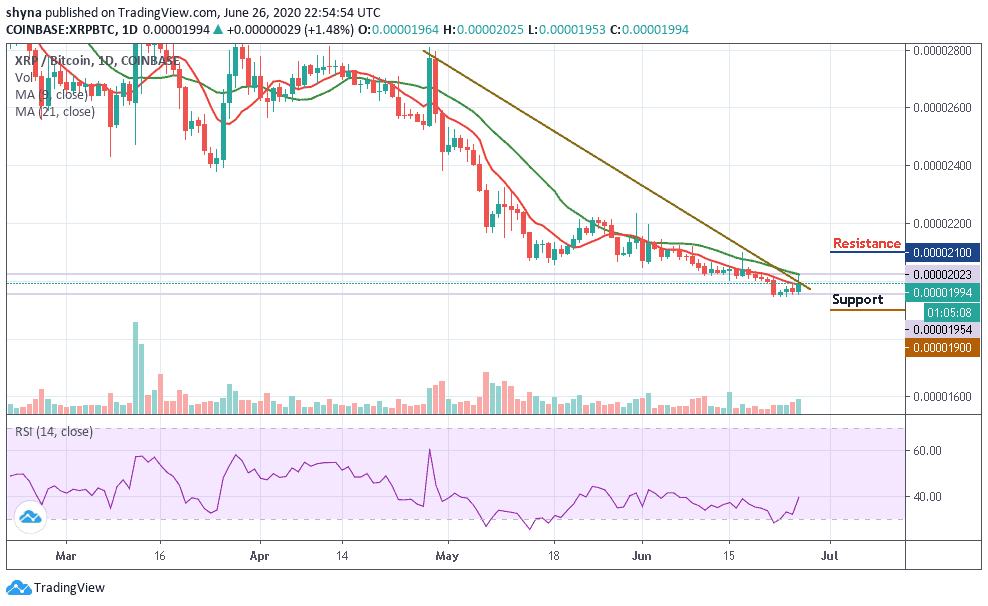
Moreover, looking at the daily chart, if the bulls failed to hold the price, then it may likely experience more downtrends and the nearest support levels for the coin are 1900 SAT and 1800 SAT. Meanwhile, the technical indicator RSI (14) moves to cross above 40-level, which indicates more bullish signals.
Join Our Telegram channel to stay up to date on breaking news coverage