
Join Our Telegram channel to stay up to date on breaking news coverage
The price of Bitcoin has been a subject of great interest and speculation among crypto enthusiasts and investors.
Amid the ever-fluctuating nature of Bitcoin’s value, the recent stabilization at $26,700 has raised the question of whether this marks the conclusion of the latest downward trend.
Analysis of BTC Price Movements
Since January 2023, the price of Bitcoin (BCT) has experienced significant surges accompanied by high volatility.
In early January, Bitcoin started trading at a low of $16,540 but recorded a price increase to $21,157 on January 18, 2023. The coin closed the month with a further increase to $23,137.
The momentum continued in February as the coin traded between $22,000 and $23,000, with occasional drops to the $21,000 price level.
On March 10, the asset experienced a sharp dip to a low of $20,195 but regained momentum to $24,179.
With added pressure from the bulls, BTC rose again by 39.95% to $28,264 on March 22 and maintained that level.
April experienced some price fluctuations between $26,000 & $28,000 but later pumped to $30,261 on April 11. BTC closed the month with a slight decrease to $29,362.
Since then, the asset has not been able to reach that $30,000 milestone.
Assessing The Potentials For Subsequent Increase
Bitcoin (BTC), being the first and the mother of all cryptocurrencies, still holds the first position in terms of market capitalization as of May 22, 2023.
The asset has grown exponentially from being just a peer-to-peer version of electronic cash to a store of value and also a potential hedge against inflation.
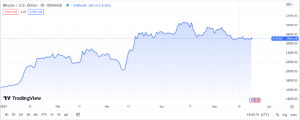
The BTC/USDT chart has been on an uptrend since the beginning of this year. The trading pair has increased by 62.84% using today’s current price of $26,934.
Despite the high volatility & fluctuations, the bulls are still in control of the BTC market and are strongly holding their respective positions.
Notably, with how the bulls are maintaining the price momentum on a daily chart, it will be difficult for the bears to push down the price further.
Furthermore, Bitcoin’s (BTC) dominance is up today by 0.02%, indicating that Bitcoin’s share of the total cryptocurrency market cap has risen slightly.
This suggests that investors and traders have increased confidence in Bitcoin compared to alternative cryptocurrencies.
The 24-hour trading volume is up by 37.3%, representing a value of over $28 billion. This indicates that in the last 24 hours, the BTC has been experiencing high trading activities.
Additionally, the forthcoming BTC halving slated for 2024 is another bullish fundamental that might push the price of BTC up.
According to the BTC halving countdown clock, the halving is scheduled at block 840,000, which is predicted to be solved on April 27, 2024, 07:15:55AM UTC.
The halving decreases the number of new Bitcoins generated per block. This means there’ll be a low supply of Bitcoin, making buying more expensive.
The first BTC halving event on November 28, 2012, caused a price increase of about 2066.67% from around $12 to a peak of approximately $260 by April 2013.
The second and third halving events also pushed the price up significantly. Investors and traders are very optimistic about the forthcoming halving event.
BTC Formed A Fallen Wedge Pattern
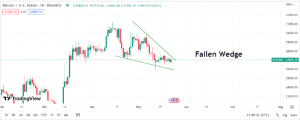
According to the daily chart of BTC, the asset has formed a fallen wedge. It typically indicates a potential bullish reversal in price.
This price pattern also suggests a period of decreasing volatility and a possible shift from a downtrend movement to an uptrend price movement.
Traders and investors may view this as a potential buy signal because it signifies that buyers are gradually gaining market control. Also, a breakout to the upside may occur.
Key Levels Of Support And Resistance
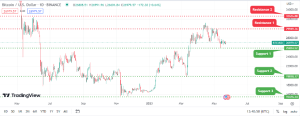
Based on the chart above, BTC/USDT currently trades between its primary support and resistance levels of $25,824 and $29,926.
With the recent momentum from BTC bulls, the market might hit the break of the primary resistance level soon.
The next key support levels are $19,818 & $15,476, while the next key resistance level is $32,626.
BTC Technical Review Using Indicators
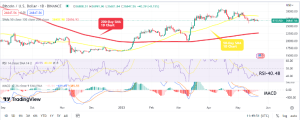
BTC/USDT currently trades above the 200-Day Simple Moving Average (SMA). This means that BTC is bullish on the longer timeframe.
Currently, the Relative Strength Index (RSI) value is at 40.48, indicating that the BTC market is neutral.
However, the Moving Average Convergence/Divergence (MACD) is below the signal line, which suggests a weakening of the current trend.
Also, the 50-Day Simple Moving Average (SMA) indicates short-term bearish momentum in the market.
Based on the indicators mentioned above, the current analysis suggests that Bitcoin (BTC) may undergo a period of consolidation or a short-term price range.
After this phase, we may see a potential upward movement toward a new weekly or monthly high.
Technical analysis/indicators are subjective and do not guarantee future performance. It should be in conjunction with other analysis tools.
Factors Influencing Bitcoin’s Price Outlook
Like many other crypto assets, the price of Bitcoin (BTC) is influenced by supply and demand dynamics.
Notable events such as block reward halving, hard forks, or new protocol updates can heavily affect the price action of BTC.
Also, regulatory development, adoption by institutions and government, different digital exchanges, and real-world events can influence BTC prices positively.
In conclusion, Market sentiment and investor confidence play a significant role in determining the demand and price of Bitcoin.
Positive sentiment, driven by media coverage, positive news, or favorable market conditions, can lead to increased buying activity, price appreciation, and vice versa.
Join Our Telegram channel to stay up to date on breaking news coverage