
Join Our Telegram channel to stay up to date on breaking news coverage
Bitcoin price trades at $26,045, rising 16.21% in the last 24 hours as the latest Consumer Price Index (CPI) data for February 2023 came in. The big crypto flashed above $26,400, levels last seen in June last year as its market cap crossed the half-a-trillion mark.
Other top-cap cryptos were also flashing green with Ethereum, the second largest cryptocurrency by market capitalization, soaring 9.67% over the last day to brush shoulders with $1,750. Binance Coin was also up 5.56% to trade at $316 while the international remittances token XRP has rallied 5.05% over the same time frame to exchange hands at $0.38.
Other top non-stablecoin cryptos such as Cardano, Polygon and Dogecoin posted 7.67%, 10.04% and 9.43% gains on the day respectively. The total crypto market cap is back above the $1 trillion mark after rising 11.94% to the current value of $1.14 trillion, according to data from CoinMarketCap.
Top 10 Cryptos

The US banking crisis occasioned by the collapse of three crypto-friendly banks Signature Bank, Silicon ValleyBank and Silvergate bank appears to be wearing out as the Crypto Fear and Greed Index slid into the “Greed” zone on Tuesday.
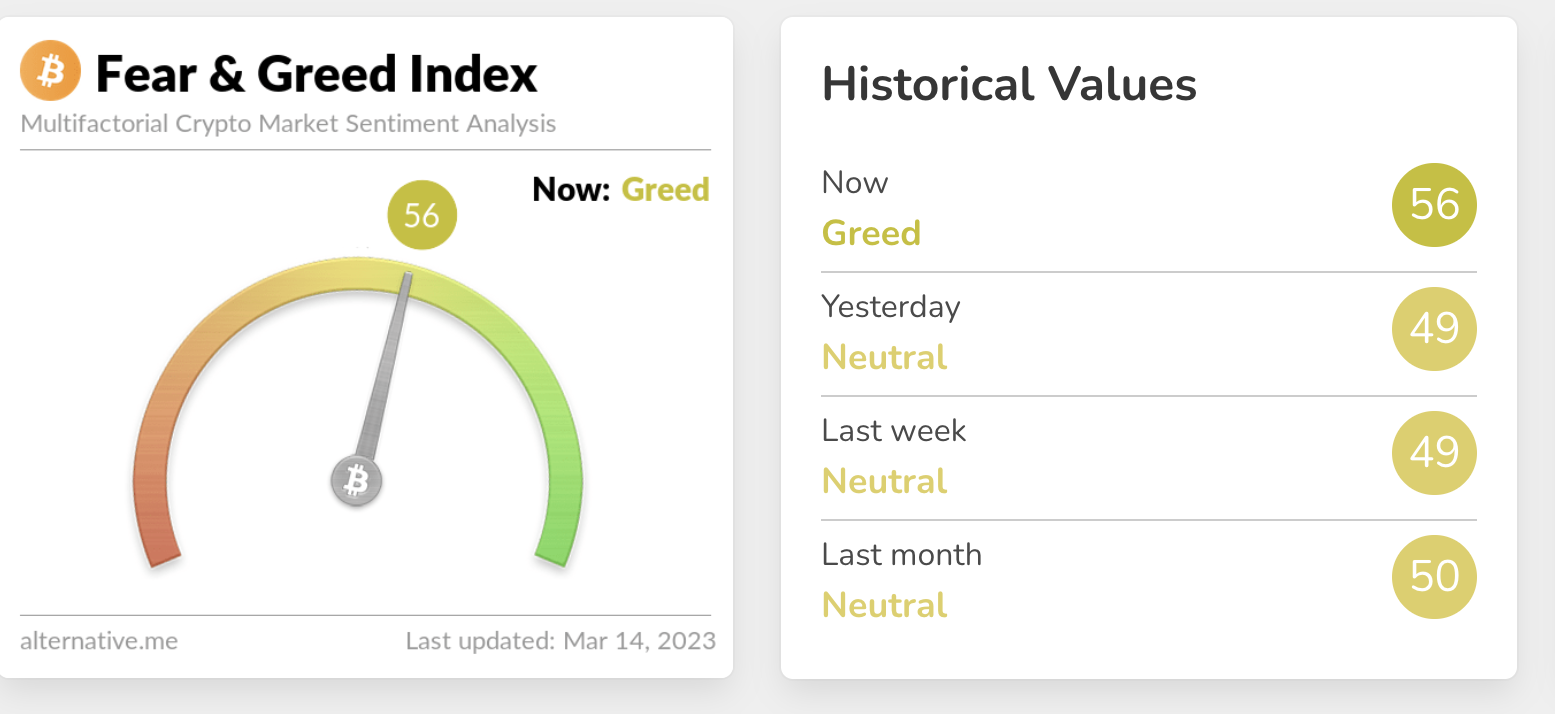
According to Alternative, an organization that analyzes market sentiments around Bitcoin and other cryptocurrencies, “people tend to get greedy when the market is rising which results in FOMO (Fear of missing out).” This appears to be the case in the crypto market at the moment.
Bitcoin Price Reacts Positively To CPI Data
Traders are afraid of missing out on the short-term gains occasioned by the United States Department of Labour’s CPI data which rose by 0.4% in February 2023. The department also noted that the all-items index indicating inflation increased by 6% over the last 12 months. The Labour department observes that inflation saw its losers increase over the last year since the period ending September 2021.
Traditional finance markets reacted with volatility after the release of the CPI data with the big crypto reacting positively as earlier explained. at the time of writing, Bitcoin was trading in a fourth consecutive bullish session with today’s surge bringing the total gains to 33.5% over the last four days.
Note that the moving averages were facing up and Relative Strength Index (RSI) was moving northward into the positive region. This suggested that the buyers were in control of the pioneer cryptocurrency. Note that BTC’s uptrend will gain momentum once the RSI crosses the 70-value line into the overbought region.
BTC/USD Daily Chart
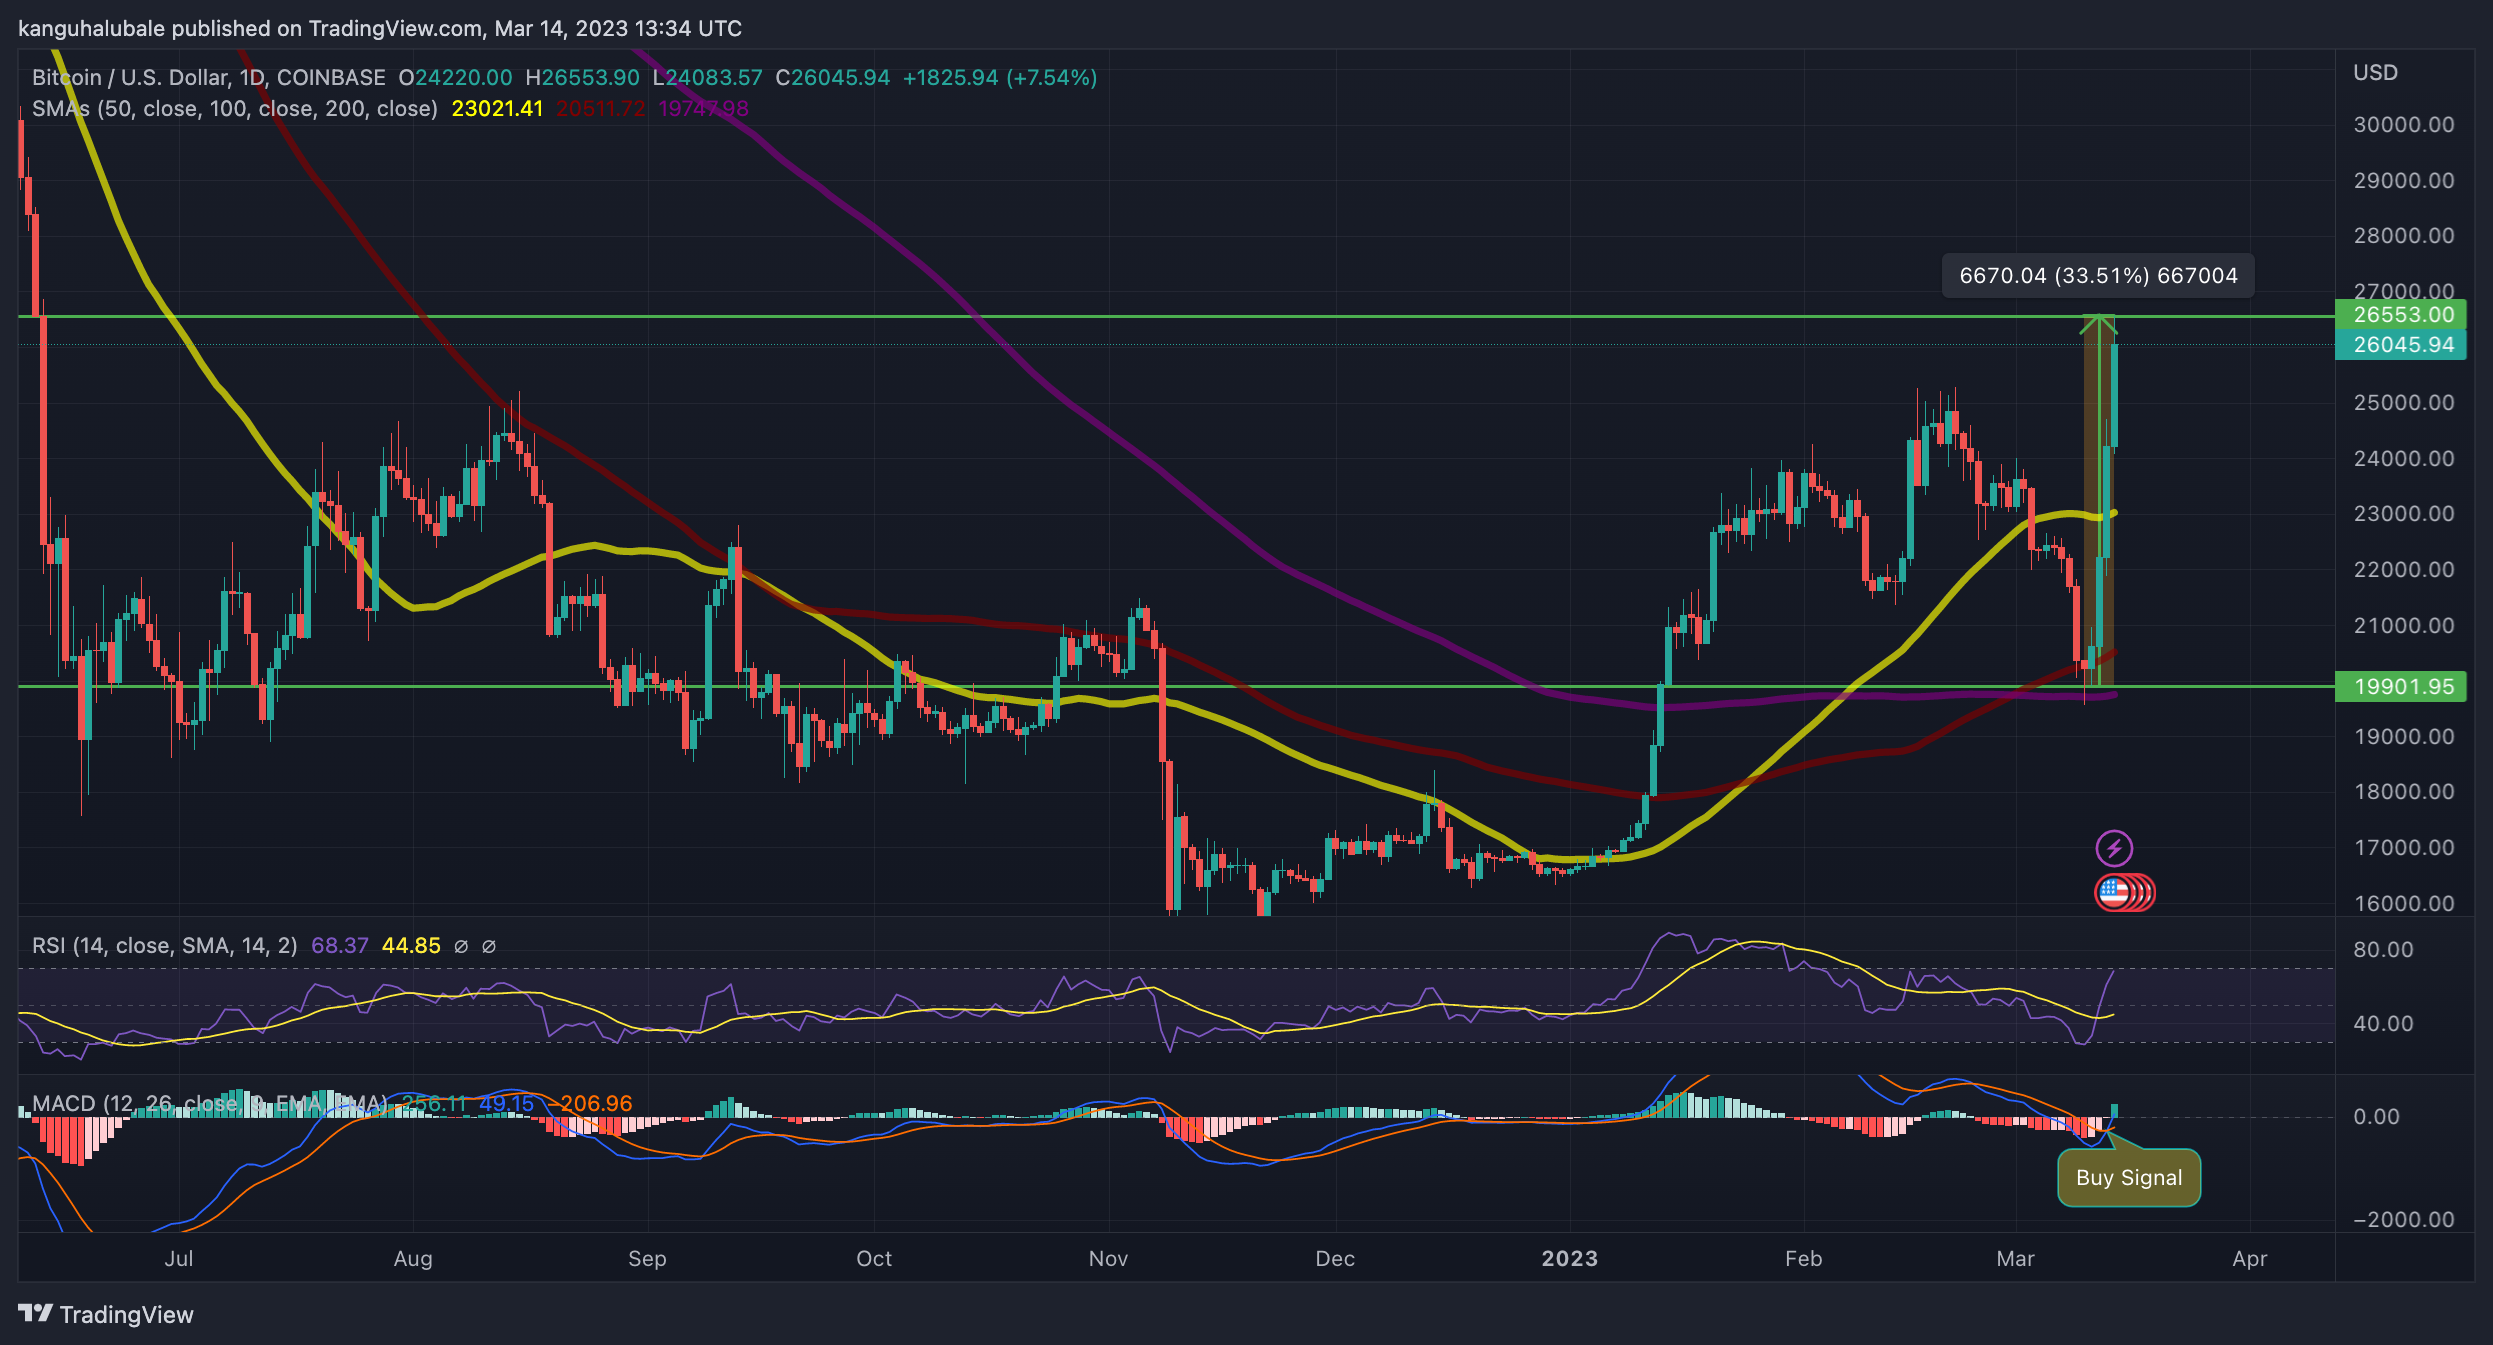
Note that the Moving Average Convergence Divergence (MACD) has sent a call to buy Bitcoin on the daily chart. This occurred on Monday when the 12-day Exponential Moving Average (EMA) crossed below the 26-day EMA, adding credence to the bullish outlook.
As such, Bitcoin’s price may continue rising with a move from the current price taking it first to $28,000 and later $30,000 in the near term.
Despite this, not everyone is impressed by Bitcoin’s sudden surge in price. Peter Schiff, who took to Twitter yesterday to say that although Bitcoin’s price has gone up more than gold’s price, doesn’t make it a better hedge against inflation moments ago received a response from CZ, Co-Founder and CEO of Binance. CZ jokingly said that everyone knows that gold is almost as good as Bitcoin.
We know. We know Gold is almost as good. 😂
— CZ 🔶 BNB (@cz_binance) March 14, 2023
The Flip Side
Note that if the current buying pressure is not sustained and Bitcoin turns down as evidenced by the near overbought conditions painted by the RSI, it may drop to tag the $25,000 psychological level and later below the 50-day Simple Moving Average (SMA) at $23,000. A move lower could see the price of the flagship cryptocurrency drop to revisit the local low at $19,750, embraced by the 200-day SMA.
Related News:
- Security firm Halborn warns that over 280 blockchains are at risk of zero-day exploits
- US Justice Department launched an investigation into the TerraUSD collapse
- How to Buy Bitcoin
Join Our Telegram channel to stay up to date on breaking news coverage