Join Our Telegram channel to stay up to date on breaking news coverage
Bitcoin Price Analysis (BTC) – May 9
The Bitcoin price is seen pulling back because of severe selling pressure on the market.
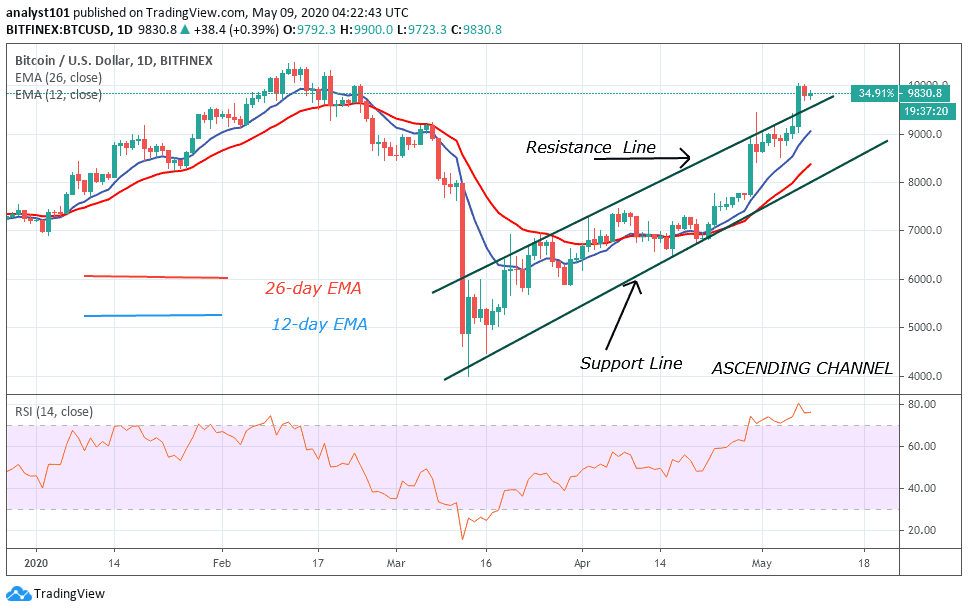
BTC/USD Long-term Trend: Bullish (Daily Chart)
Key levels:
Resistance Levels: $11,200, $11,400 $11,600
Support Levels: $8,200, $8,000, $7,800
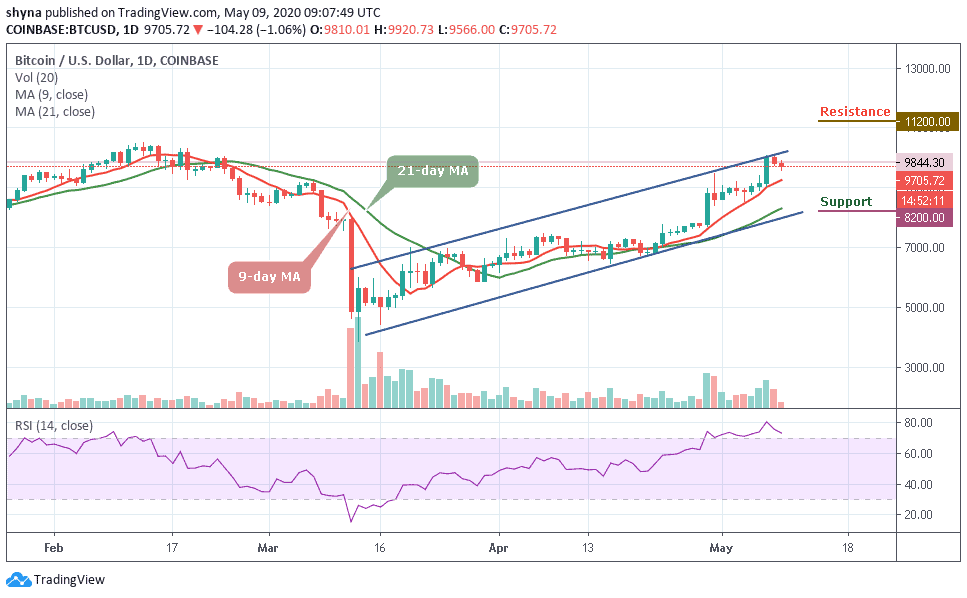
BTC/USD market has been in the overbought condition since April 29. In the long-run, the bulls break above $10,000 resistance level on two occasions and then pulled back as the price remains above the 9-day and 21-day moving averages. Moreover, as long as the technical indicator RSI (14) remains within the overbought zone, there is likely to be a downward correction that may come to play as soon as the signal begins to leave the region.
Furthermore, before the resumption of the upward trend, BTC/USD may likely pullback and retraces to the support level of $9,000. This could increase the chances of a rally above $10,500. However, once the price pulls back below the 9-day moving averages, this is an indication that BTC/USD is getting weaker. More so, the fear of a downward move may likely come to pass. For now, the RSI (14) is currently at around 72.45-level, which indicates that the market is in the overbought region.
Expectantly, to sustain the upward movement, the bulls will have to break above the channel at $10,300 resistance level. Further bullish movement may reach the potential resistance levels at $11,200, $11,400, and $11,600 respectively. While $8,200, $8,000, and $7,800 will serve as the major support levels, making room for the Bitcoin price to fall even further.
BTC/USD Medium-term Trend: Bullish (4H Chart)
On the 4-hour chart, the bears are now dominating the market tremendously while the bulls are trying to defend the $9,500 support as well. Meanwhile, the $9,200 and below may come into play if BTC breaks below the mentioned support.
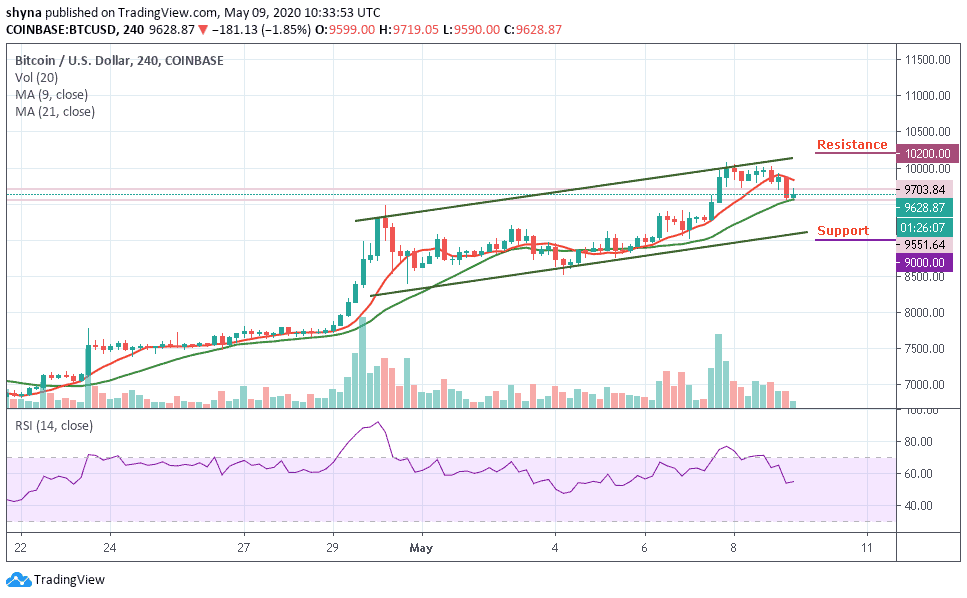
But in as much as the buyers can reinforce and power the market once again, traders can expect a retest at $10,000 resistance level, and breaking this level may further allow the bulls to reach $10,200 and above. Currently, the technical indicator RSI (14) is around 53.89-level which may move in sideways in the nearest term.
Please note: Insidebitcoins.com is not a financial advisor. Do your research before investing your funds in any financial asset or presented product or event. We are not responsible for your investing results.
Join Our Telegram channel to stay up to date on breaking news coverage