Join Our Telegram channel to stay up to date on breaking news coverage
Bitcoin Price Analysis (BTC) – September 9
The Bitcoin price is down from $11,900 to $10,300 in the last 30 days. No quick recovery seems possible for the coin.
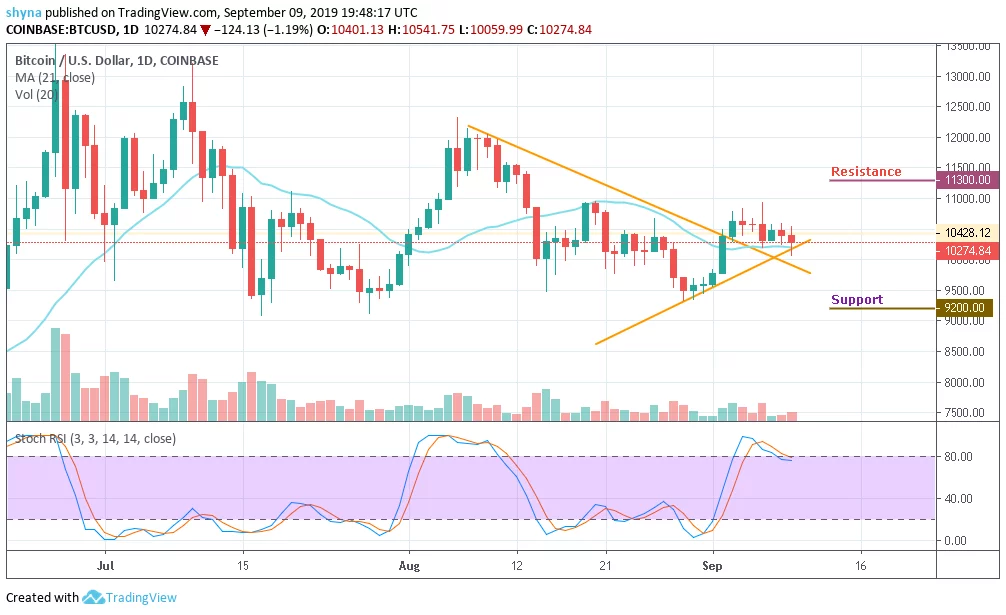
BTC/USD Long-term Trend: Bearish (Daily Chart)
Key levels:
Resistance Levels: $11,300, $11,600 $11,900
Support Levels: $9,200, $8,900, $8,600
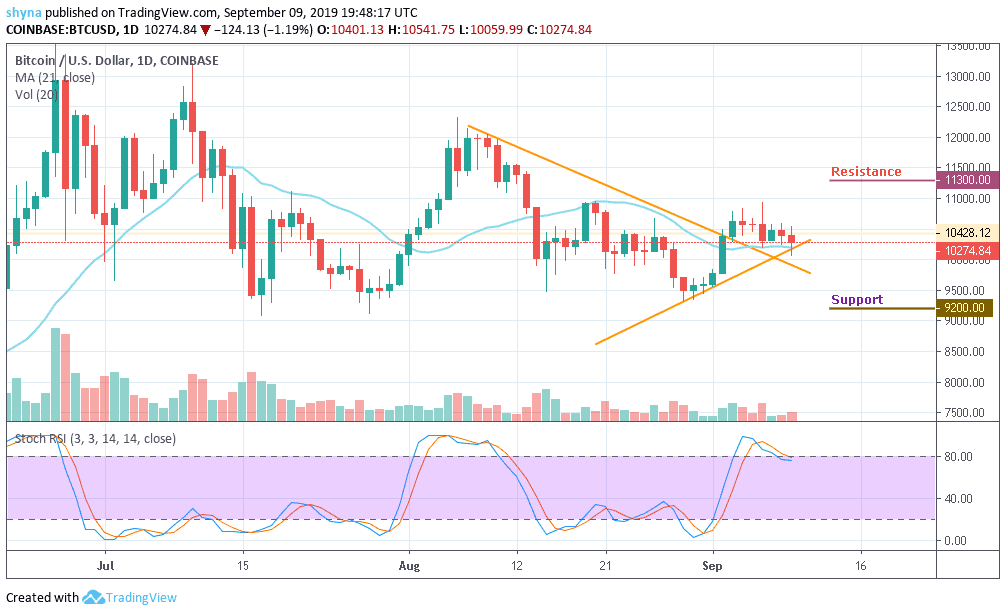
Bitcoin might have faced a setback for now; this is not a permanent one. The coin is likely to have a bullish run in the short-term but a price rally may help the coin to touch its monthly high. Currently, Bitcoin is trading around $10,274 level after a free fall from $10,918 a few days back. The coin has shown tremendous volatility over the past 30 days.
Meanwhile, looking at the daily chart, $9,200, $8,900 and $8,600 serves as the major support levels, making room for BTC to fall even further. The stochastic RSI for the coin is recovering from the overbought as trading volume is fading out. BTC/USD may see resistance levels at $11,300, $11,600 and $11,900.
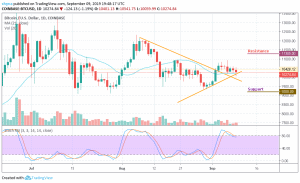
BTC/USD Medium-term Trend: Ranging (4H Chart)
A few days ago, the Bitcoin price surged upwards of over $200 within 24 hours, catapulting its price from $10,144 to reach around $10,436. After the sudden rise, the coin started dropping in price to where it’s trading currently at $10.312. Should the price continue to drop further, it could reach the nearest supports at $9,900, $9,600 and $9,300 respectively.
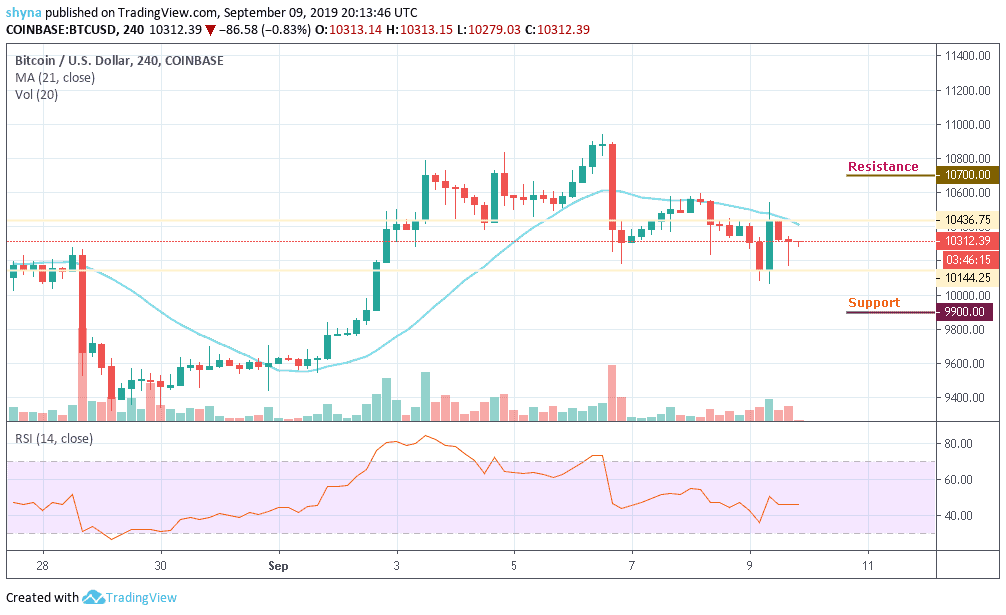
Moreover, if the bulls push the coin above the blue-line of the 21-day moving average, the price of Bitcoin could hit the critical resistance at $10,500 before heading to the potential resistance levels of $10,700, $11,000 and $11.300. More so, the market is indecisive as the RSI (14) indicator moves in sideways.
Please note: Insidebitcoins.com is not a financial advisor. Do your research before investing your funds in any financial asset or presented product or event. We are not responsible for your investing results.
Join Our Telegram channel to stay up to date on breaking news coverage