Join Our Telegram channel to stay up to date on breaking news coverage
Bitcoin (BTC) Price Prediction – March 24
The daily chart reveals that Bitcoin (BTC) has effortlessly zoomed above $6,500 before refreshing levels above $7,000.
BTC/USD Long-term Trend: Bullish (Daily Chart)
Key levels:
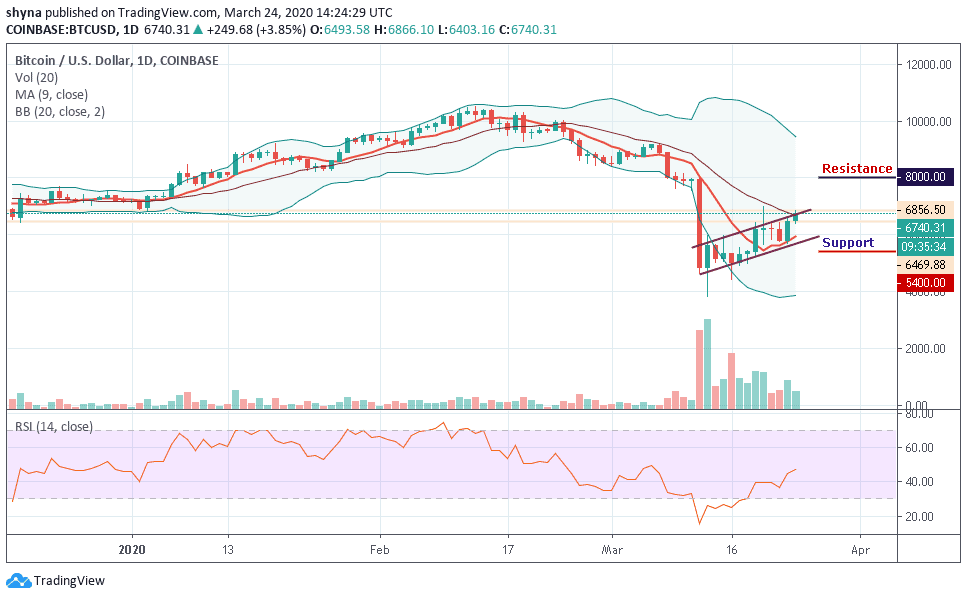
Resistance Levels: $8,000, $8,200, $8,400
Support Levels: $5,500, $5,300, $5,100
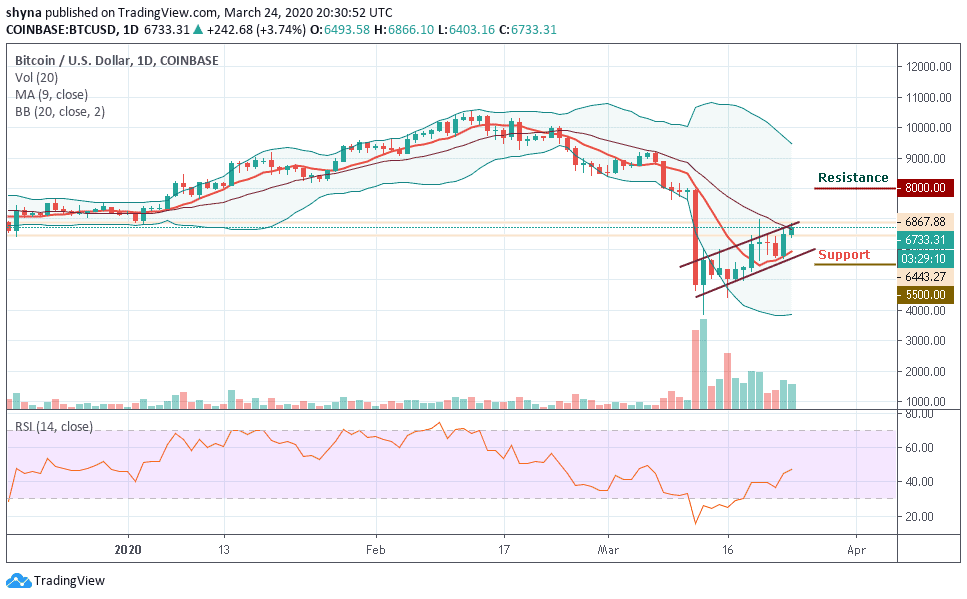
A couple of days ago, BTC/USD rose sharply and followed the bullish trend on the long-term outlook. Today, the coin bounced and propelled towards the north. More so, the Bitcoin price has broken upside by crossing the 9-day moving average and the coin is now facing the resistance level of $7,000 waiting to break out of the channel. The strong bullish daily candle formed yesterday and today on the daily chart indicates that the Bulls are fully in control.
From the long-term perspective, a sustainable move above $6,800 improved the technical picture of the number one cryptocurrency. This area may serve as an upper boundary for the previous consolidation channel. Now, if it is out of the way, $7,000 becomes a possibility. However, even stronger resistance is located at $7,200.
Meanwhile, looking at the chart, $5,500, $5,300 and $5,100 serve as the major support levels, making room for BTC to fall even further. Moreover, the technical indicator remains positive as RSI (14) for the coin is heading above 45 to indicate an upward movement as BTC/USD may see the resistance levels at $8,000, $8,200 and $8,400.
BTC/USD Medium-Term Trend: Bullish (4H Chart)
Looking at the 4-hour chart, Bitcoin’s price is currently trading around $6,652 and above the 9-day moving average after a reversal from $6,513 of two days ago. Meanwhile, the daily chart reveals that the bullish supply is coming up slowly within the market while the bears are also trying to drag the price down.
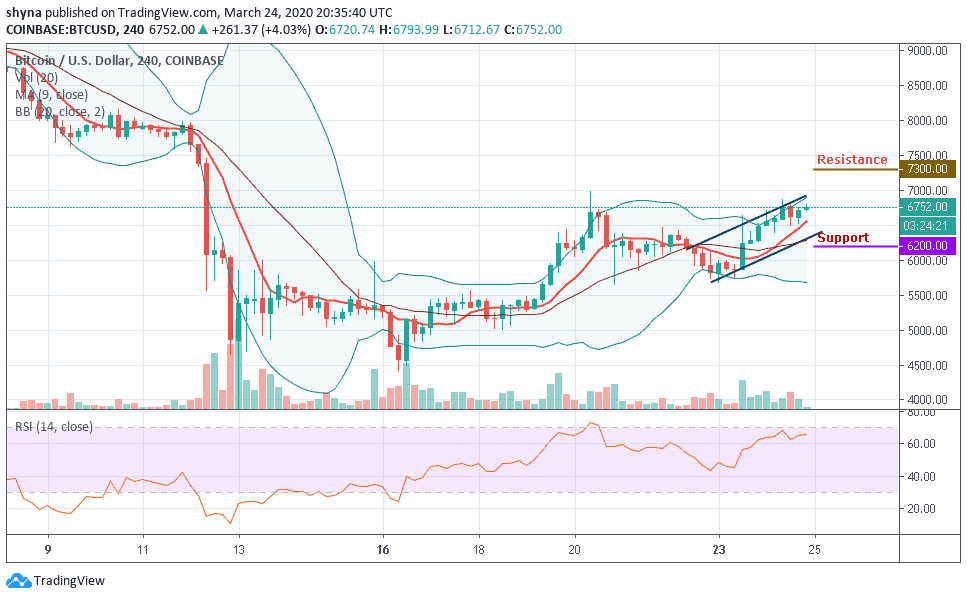
However, if the buyers can put more effort and energize the market, they can further push the price to a $7,000 resistance level. Therefore, breaking the mentioned resistance could also allow the bulls to test the $7,300 and above. Meanwhile, the $6,200 and below may come into play if BTC breaks the $6,300 support. In other words, there’s hope for the buyers as soon as the RSI (14) crosses into the overbought zone.
Please note: Insidebitcoins.com is not a financial advisor. Do your research before investing your funds in any financial asset or presented product or event. We are not responsible for your investing results.
Join Our Telegram channel to stay up to date on breaking news coverage