Join Our Telegram channel to stay up to date on breaking news coverage
Bitcoin Price Analysis (BTC) – August 12
Bitcoin (BTC) created a mirage while it surged; Currently, trade below $11,450.
BTC/USD Long-term Trend: Bullish (Daily Chart)
Key levels:
Resistance Levels: $13,000, $13,500 $14,000
Support Levels: $9,500, $9,000, $8,500
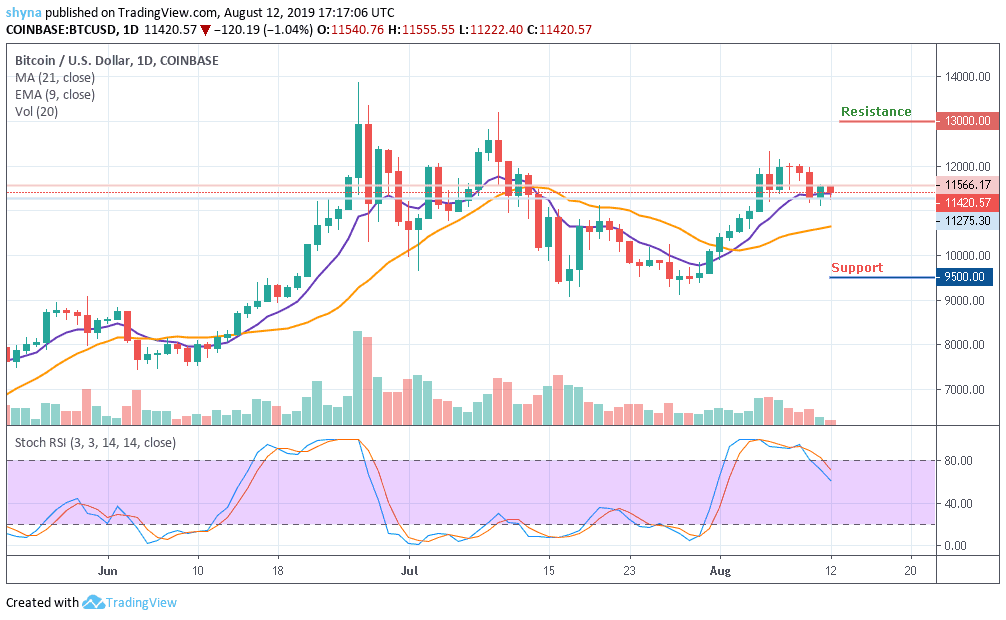
Bitcoin was seen trading at $11,358 a few hours ago, and it then soared as high as $11,400 from there. The coin then pulled back to $11,387 and continued to head downwards. The coin hit the bottom at $11,275 with a decline of $0.78%. Finding support there, the coin then rebounded to $11,401.06.
Now, the market is deciding around $11,420, where the buyers are anticipating for a clear breakout. Meanwhile, the $12,100 and $12,250 levels may further surface as critical resistances should the $12,000 level holds. However, a strong bullish spike might take the price to $13,000, $13,500 and $14,000 levels.
If the market decides to go down, Bitcoin’s price may drop to $10,500 and should this support fails to contain sell-off, we may see a further roll back to $9,500, $9,000 and potentially $8,500. The Stochastic RSI for Bitcoin price suggests an extremely overbought market. Turning downward, the market may fall to immediate supports.
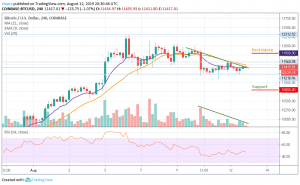
BTC/USD Medium-term Trend: Ranging (4H Chart)
BTC/USD trades within the range of $11,200 to $11,450. Nevertheless, Bitcoin has not yet slipped below $11,000 and is still in the loop of making a bounce back. BTC price hovers around $11,400 and may take time to persistently trade above $11,800. At the moment, BTC price is currently moving around $11,417 level. The upward movement is facing hurdles near the $11,800 and $12,000 resistance levels.

Furthermore, on the downside, immediate support is near the $11,000 level while the main support is at the $10,800 level. The price might slide sharply below $10,600 which may likely test the main support at $10,400 level. Technically, Bitcoin is poised for more losses in the near-term as RSI (14) is currently moving in sideways and above 40-level, indicating indecisive market movement.
Please note: insidebitcoins.com is not a financial advisor. Do your own research before investing your funds in any financial asset or presented product or event. We are not responsible for your investing results
Join Our Telegram channel to stay up to date on breaking news coverage