Join Our Telegram channel to stay up to date on breaking news coverage
Bitcoin Price Analysis (BTC) – July 19
Bitcoin has now been declared a virtual property legally recognized by a Chinese court. Bitcoin has the characteristics to be considered a virtual property and therefore owning Bitcoin will be legal in China. Is that why BTC is rising?
BTC/USD Long-term Trend: Bullish (Daily Chart)
Key levels:
Resistance Levels: $13,500, $14,000 $14,500
Support Levels: $8,000, $7,500, $7,000
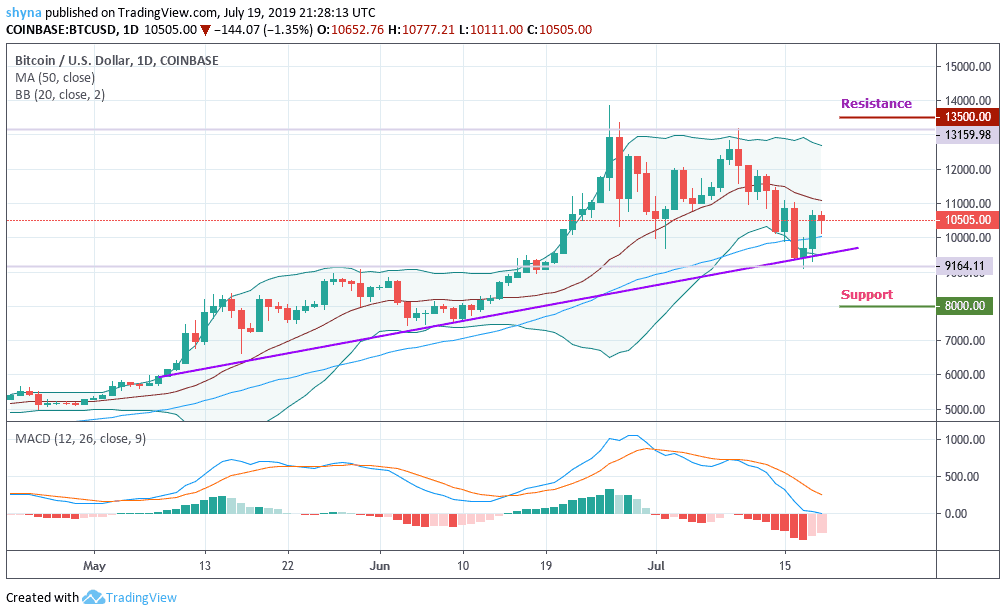
Bitcoin has increased more than 8% over the past 24 hours to $10,500 at the time of writing. The first digital cryptocurrency was linked to the early hours of Asia, thus consolidating the gains of the previous session. A sustained movement of more than $10,000 has improved the technical situation in the long term; however, the critical amount of $11,000 will not be interrupted at this time. The market price is evolving above the 50-day MA and this could give Bitcoin a boost of over $10,800.
Furthermore, the daily chart shows $10,000 as being a viable support level. As long as BTC stays above $10,000, a correction towards $11,000 is possible and after hitting it, the price may likely visit the next resistance levels at $13,500, $14,000 and $14,500. Other key support levels to look out for are $8,000, $7,500 and the primary support at $7,000. The MACD is sitting comfortably in the positive region while the decreasing negative divergence suggests that the bulls are gaining traction.
BTC/USD Medium-term Trend: Bullish (4H Chart)
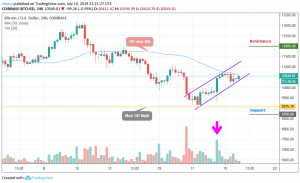
According to the 4-hour chart, with the sudden move of Bitcoin price above $10,000, Bitcoin’s chances of violating the old support of $9,075 (the highest on May 30) became resistance, weakened. That said, the bulls are not out of the wood yet and a break above $11,000 is needed to invalidate the bearish case.
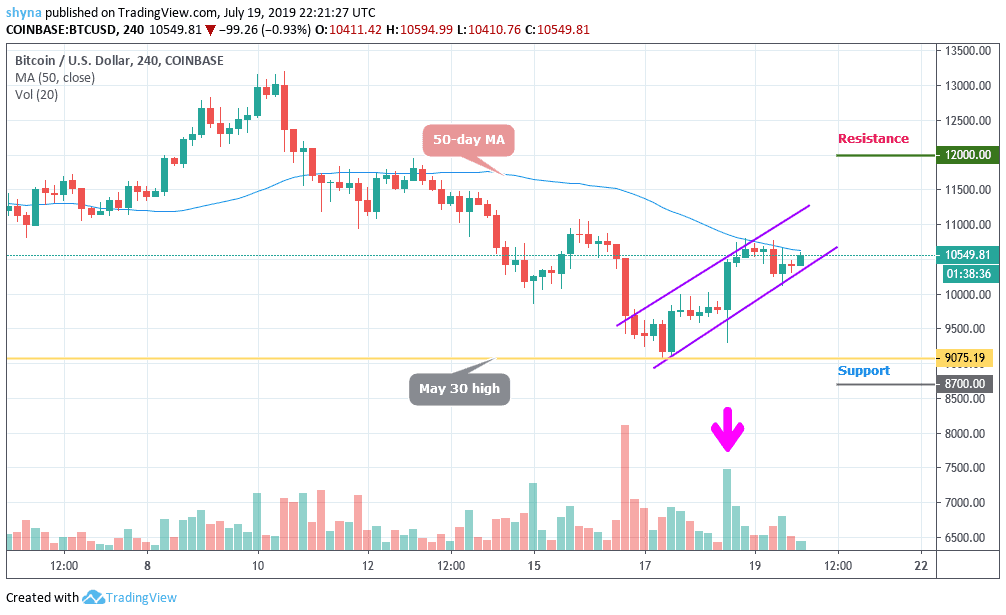
In addition, a high-volume break above $10,815 would violate the bearish pattern of the highs and shift the risk to a rise of $12,000 and above. In particular, the movement above $10,000 is supported by an increase in buying volumes (the pink arrow). As a result, prices could reach $11,000 in the next 24 hours and it’s been supported by $8,700 level and below.
Please note: insidebitcoins.com is not a financial advisor. Do your own research before investing your funds in any financial asset or presented product or event. We are not responsible for your investing results.
Join Our Telegram channel to stay up to date on breaking news coverage