Join Our Telegram channel to stay up to date on breaking news coverage
Key Points
- Bitcoin cash price recovered and moved above the $520 and $540 resistance levels against the US Dollar.
- There is a major contracting triangle forming with support near $545 on the 4-hours chart of the BCH/USD pair (data feed from Kraken).
- The pair has to stay above the $545 and $540 support levels to remain in an uptrend in the near term.
Bitcoin cash price failed to settle above $600 and declined against the US Dollar. BCH/USD is currently testing an important support area near $540.
Bitcoin Cash Price Support
After a major decline, bitcoin cash price found support near the $465 level against the US Dollar. The BCH/USD pair started a recovery and moved above the $500, $520, $540 and $580 resistance levels. There was even a spike above the $600 level. However, the price failed to settle above the $600 level and found sellers near the 100 simple moving average (4-hours). A high was formed at $613.7 and the price started declining.
It broke the 23.6% Fib retracement level of the last wave from the $468 low to $613 high. However, the price is now trading near a major support area at $540. The stated zone near $540-550 acted as a support earlier and it could prevent declines this time. There is also a major contracting triangle forming with support near $545 on the 4-hours chart of the BCH/USD pair. Moreover, the 50% Fib retracement level of the last wave from the $468 low to $613 high is near $540. Therefore, a break and close below the $540 support could push the price back in a bearish zone.
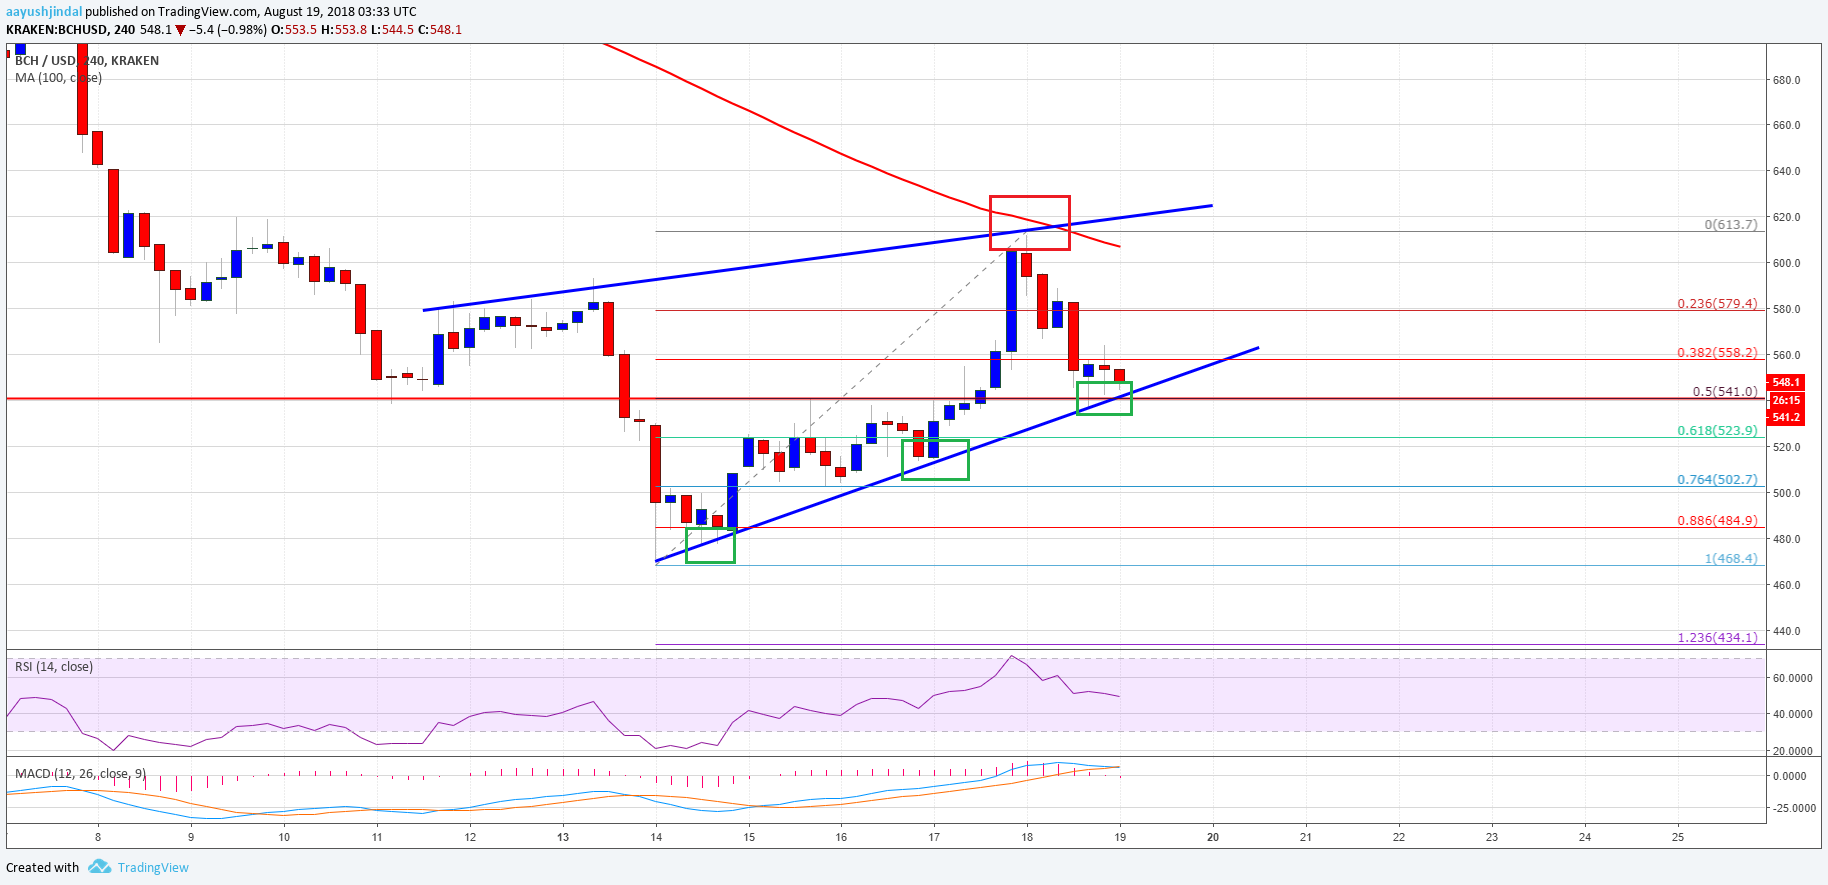
Looking at the chart, BCH price is currently holding the $540 support. If it continues to hold, it could bounce back towards $600 and $620.
Looking at the technical indicators:
4-hours MACD – The MACD for BCH/USD is about to move back into the bearish zone.
4-hours RSI (Relative Strength Index) – The RSI for BTC/USD is currently just near the 50 level.
Major Support Level – $540
Major Resistance Level – $600
The post Bitcoin Cash Price Weekly Analysis: BCH/USD Holding Key Support at $540 appeared first on NewsBTC.
Join Our Telegram channel to stay up to date on breaking news coverage