

Join Our Telegram channel to stay up to date on breaking news coverage
BCH Price Analysis – April 4
The Bitcoin Cash price resumes the uptrend and reclaims the resistance level $240 amid market bullish pressure.
BCH/USD Market
Key Levels:
Resistance levels: $275, $295, $315
Support levels: $190, $170, $150
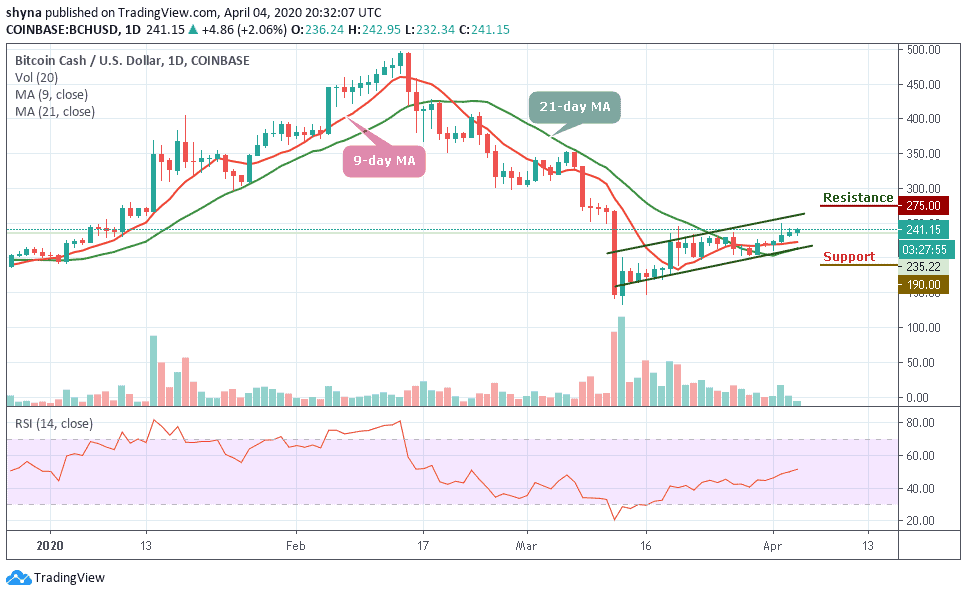
Today, BCH/USD indicates an upward trend in the ascending channel market, trading above the 9-day and 21-day moving averages. A few days ago, it was revealed that BCH followed a bearish movement but currently the market is planning a volatile move in which Bitcoin Cash may move moderately. Meanwhile, as the daily chart reveals, the BCH market may soon come out of this phase and make an effort to regain its initial momentum over time.
In addition, the price of the BCH is trading at $241.15 and still moving at the middle boundary of the channel but any move below the moving averages could bring the price to the support levels of $190, $170, and $150. On the upside, a sustained move above $250 could ease the initial downside pressure and create momentum for the bulls with the focus to move the market to the next resistance levels of $275, $295 and $315 respectively.
However, Looking at the daily chart, the RSI (14) is currently looking bullish as the trading volume is becoming low due to the recent drop in Bitcoin dominance. Meanwhile, the traders may expect more drop if the bears inject more pressure in the market.
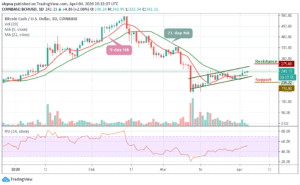
BCH/BTC Market
Against BTC, the recent sideways movement is due to price stability which shows that the resistance-support is at equilibrium. Another thing to note here is that the market is preparing to change the trend and a short-term bearish breakout is most likely to play out because the technical indicator RSI (14) moves below 50-level and this could find the nearest support levels at 0.031 BTC and below.

However, the only condition for the resumption of the bullish trend is if the 0.034 BTC level can continue to provide support for the market, then the price may be pushed to the resistance level of 0.038 BTC and above. Meanwhile, the BCH/BTC pair continues to remain in sideways movement hovering above the moving averages.
Please note: Cryptovibes.com is not a financial advisor. Do your research before investing your funds in any financial asset or presented product or event. We are not responsible for your investing results.
Join Our Telegram channel to stay up to date on breaking news coverage
