Join Our Telegram channel to stay up to date on breaking news coverage
BCH Price Prediction – April 12
The trade operations between BCH and the US dollar have once again got a hike as price now trades around the high level of $700.
BCH/USD Market
Key Levels:
Resistance levels: $750, $800, $850
Support levels: $600, $550, $500
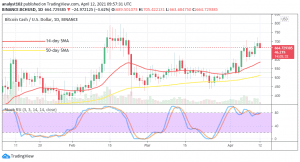
BCH/USD – Daily Chart
It is been shown on the BCH/USD daily trading chart that there has been an increase in the valuation in the crypto’s price as a slight straight-up line appears in the market’s path-way to the north. The 14-day SMA trend-line is above the 50-day SMA trend-line. And, they both signal to see more ups as their trend-lines point towards north. The Stochastic Oscillators are now moving in a consolidation moving manner around range 80 to still affirm that a buying spree is ongoing. 
Will BCH/USD price face strong rejection around the $700 level?
The BCH/USD market journey to the resistance trading point of $700 has only been briefly breached. But, price has been most of the time trade around the high level. The expectation is that the bulls need to now hold strong in the current consolidation moving bid. So that there can be room for the bullish trend to continue upward to other higher levels.
As a pit stop has come to play around the value of $700, it could be a chance for the bears to take an advantage of the market to push for reverse. Meanwhile, such a sell-action will have to be backed up with active falling pressures at that level. A more reliable downward move of this market isn’t achievable in the near session.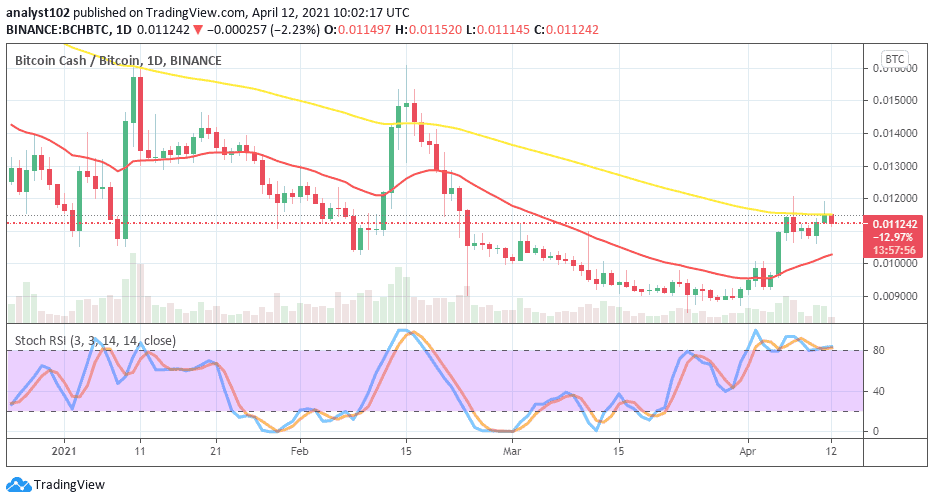
BCH/BTC Price Analysis
In the comparison, there has been a slight regain of purchasing value by BCH as paired with BTC currently. That said, the base crypto has now to contend with the breaking of an upper bearish line to substantiate a distinct return of sound recovery move against the value of the counter crypto. The 50-day SMA trading indicator is located around the trading zone with a light downward bent posture towards the east above the 14-day SMA trend-line that bends with a small curve pointing to the north. The Stochastic Oscillators are now firmly consolidating around range 80 to testify to the potentials of the base crypto recuperating motion.
Join Our Telegram channel to stay up to date on breaking news coverage