Join Our Telegram channel to stay up to date on breaking news coverage
Trade Attempts Downsizing – February 19
It has been on the BCH/USD market financial operations that the crypto-economic trade attempts downsizing at a higher resistance path of the smaller SMA trend line. The percentage rate of the crypto market is at a negative of 0.23 as the price trades between $316 and $305.
Trade Attempts Downsizing: BCH Market
Key Levels:
Resistance levels: $350, $400, $450
Support levels: $250, $200, $150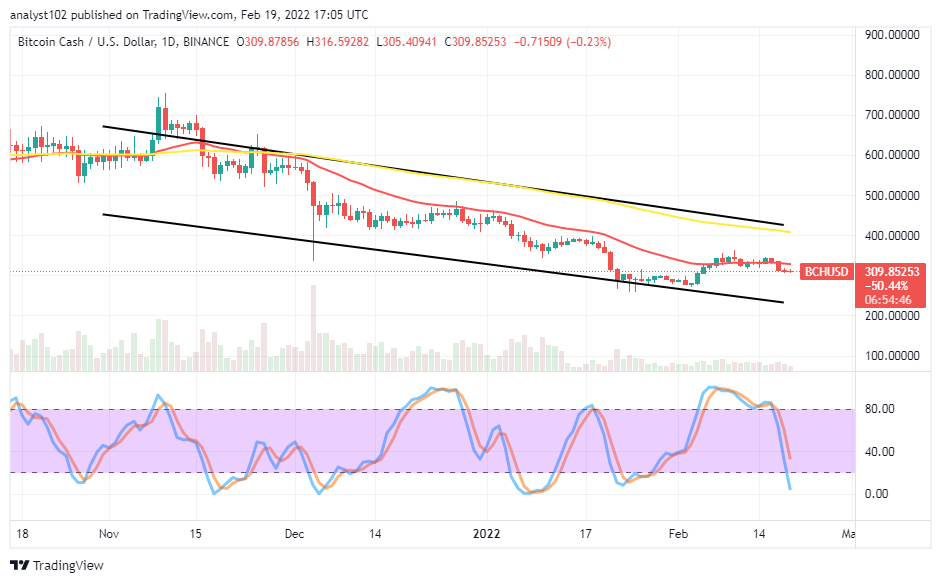 BCH/USD – Daily Chart
The BCH/USD daily chart reveals the crypto-economic trade attempts to downsize. Price seems to respond to a falling force around the trend line of the smaller SMA. The 50-day SMA indicator is above the 14-day SMA indicator. The bearish channel trend lines drew southward, indicating a continual bearish trading condition. The Stochastic Oscillators face the southward direction trying to penetrate the oversold region.
Is there any trading sign suggesting the possibility of change from the bearish trend as the crypto trade attempts downsizing?
There has been no tangible trading sign suggesting the possibility of a direction change from the current bearish trend as the BCH/USD trade attempts downsizing more on a lighter from the trend line of the 14-day SMA. Buying position signal has not taken a form as there is still a need for some smaller-downs to play out closely toward the lower bearish channel trend line drawn before the crypto economy can support in the long run.
On the downside of the technical analysis, the BCH/USD market short-position placers have to solidify their stances against any price up-surging effort around the $300. The downward force bags low-active motion to the extent that joining the move appears difficult. Therefore, traders may stay off the market at this point for a while. But, investors may hold their portfolio and even endeavor to buy more while price dips more lowly.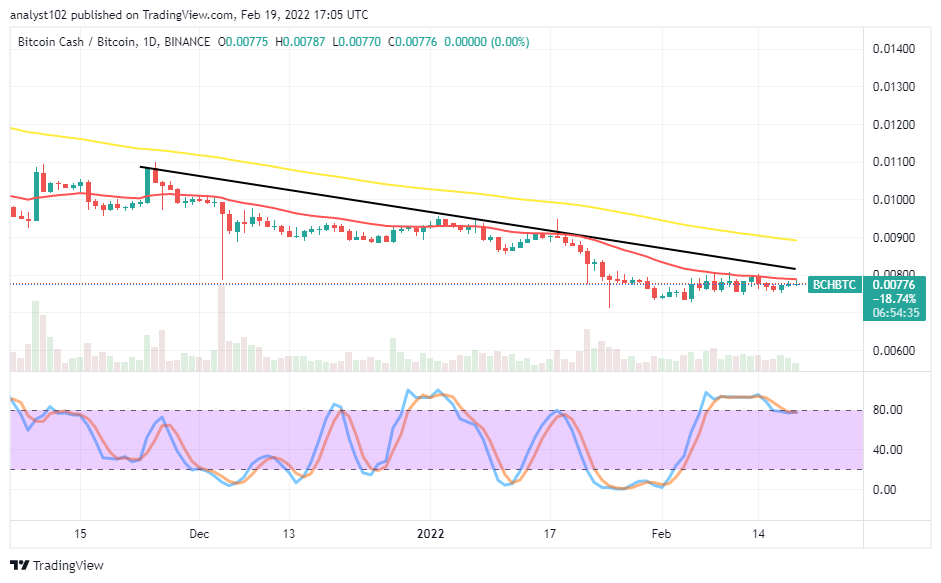
BCH/BTC Price Analysis
In comparison, Bitcoin Cash’s trending capability against Bitcoin has continued to respond to a falling force beneath the trend lines of the SMAs. The 14-day SMA indicator is below the 50-day SMA indicator. The bearish trend line drew, affirming the intensity depth of the falling force. The Stochastic Oscillators have slightly moved down to continue moving in a consolidation manner within the overbought region. It appears that the base crypto tends not to have a stronger stance against the counter-trading crypto in the subsequent sessions.
Looking to buy or trade Bitcoin (BTC) now? Invest at eToro!
68% of retail investor accounts lose money when trading CFDs with this provider.
Read more:
- How to buy Bitcoin-cash
- How to buy cryptocurrency
Join Our Telegram channel to stay up to date on breaking news coverage