Join Our Telegram channel to stay up to date on breaking news coverage
Bitcoin Cash Price Prediction – February 9
The Bitcoin Cash price prediction keeps recovering from the low of $328 level as the price remains within the short-term bullish trend.
BCH/USD Market
Key Levels:
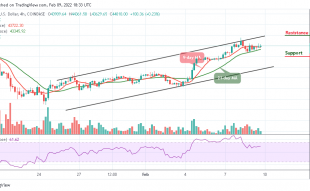
Resistance levels: $440, $460, $480
Support levels: $240, $220, $200

BCH/USD is in the hands of the bulls as the coin trades above the 9-day and 21-day moving averages. However, due to a lack of buying power, the bulls may need to gather enough momentum to push the coin above the upper boundary of the channel. The technical indicator Relative Strength Index (14) is moving to cross above 60-level with the signal line pointing to the north for more bullish signals.
Bitcoin Cash Price Prediction: Bitcoin Cash May Hold the Current Price
Looking back at the recent dip of $330, the Bitcoin Cash price is ready to break into the upside as the 9-day moving average is crossing above the 21-day moving average. However, the more the bulls pressurized the bears, the higher the coin would reach. Therefore, if the bulls maintain the upward trend, BCH/USD may continue with the bullish movement which could take the coin to the resistance levels of $440, $460, and $480.
On the other hand, any strong selling pressure may drag the price below the moving averages if the bears step back into the market, and should BTC trade below the daily opening price of $335.84, a bearish movement could take the price to the supports of $240, $220, and $200.
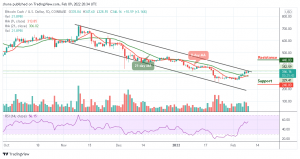
Against Bitcoin, the Bitcoin Cash is likely to cross above the 21-day moving average as the bulls increase their entries into the market. At the time of writing, the Bitcoin Cash price has not been able to push the price upward, but it is currently trading at 775 SAT. If the Bitcoin cash signals a more bullish rally, it may likely meet resistance at 860 SAT and above.
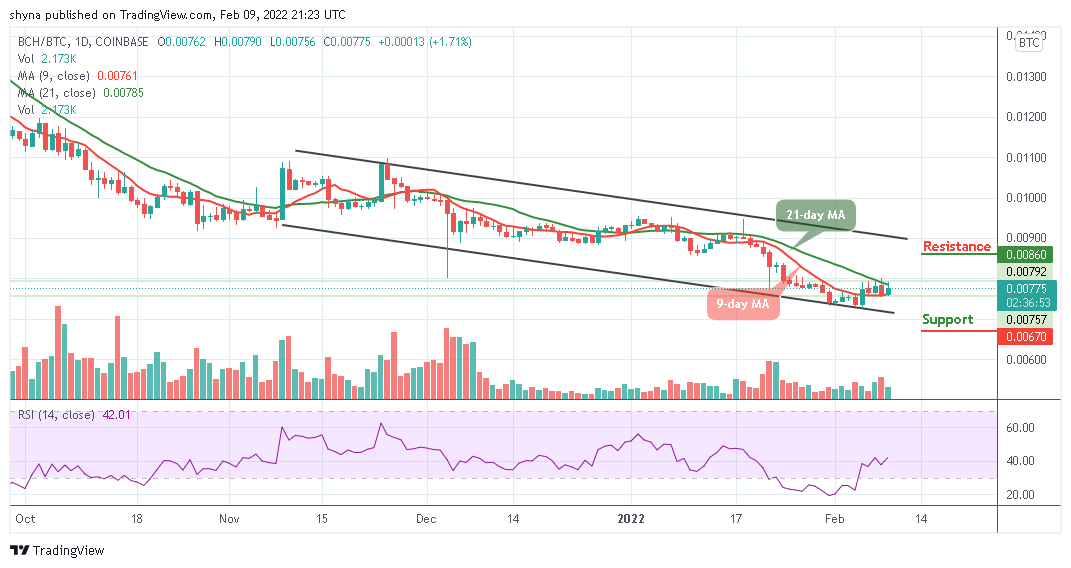
Looking at the daily chart, traders can say that the market may resume an uptrend as the technical indicator Relative Strength Index (14) moves above 40-level. More so, BCH is likely to break above the 21-day moving average where it consolidates. On the contrary, if the coin drop below the lower boundary of the channel, the price may find support at 670 SAT and below.
Looking to buy or trade Bitcoin Cash (BCH) now? Invest at eToro!
68% of retail investor accounts lose money when trading CFDs with this provider
Read more:
- How to buy Bitcoin Cash
- How to buy Cryptocurrency
Join Our Telegram channel to stay up to date on breaking news coverage