
Join Our Telegram channel to stay up to date on breaking news coverage
BCH Price Prediction – January 6
Bitcoin Cash (BCH) rides the bulls on the daily chart while the traders are expected to have a great week ahead.
BCH/USD Market
Key Levels:
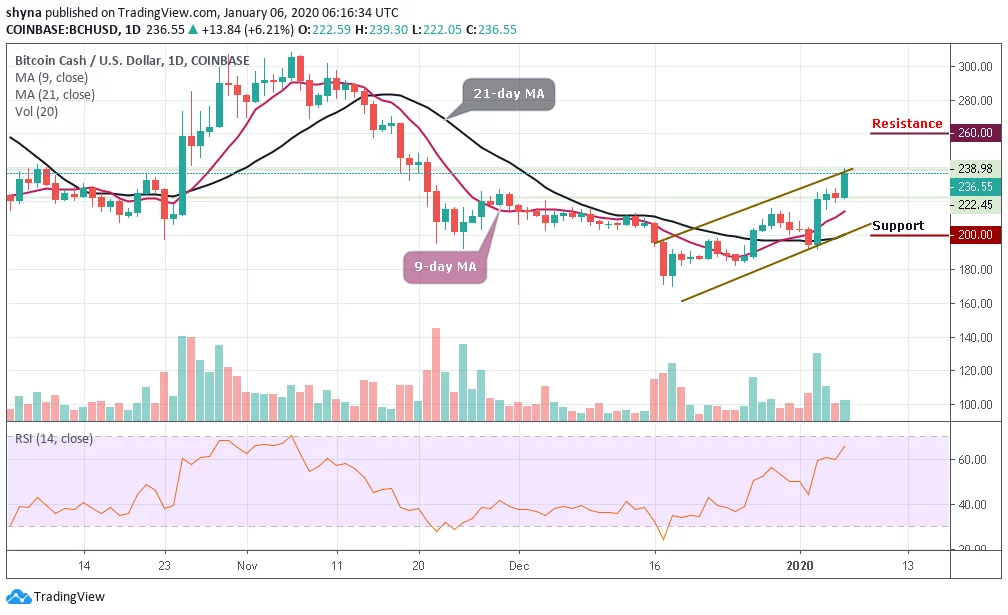
Resistance levels: $260, $270, $280
Support levels: $200, $190, $180
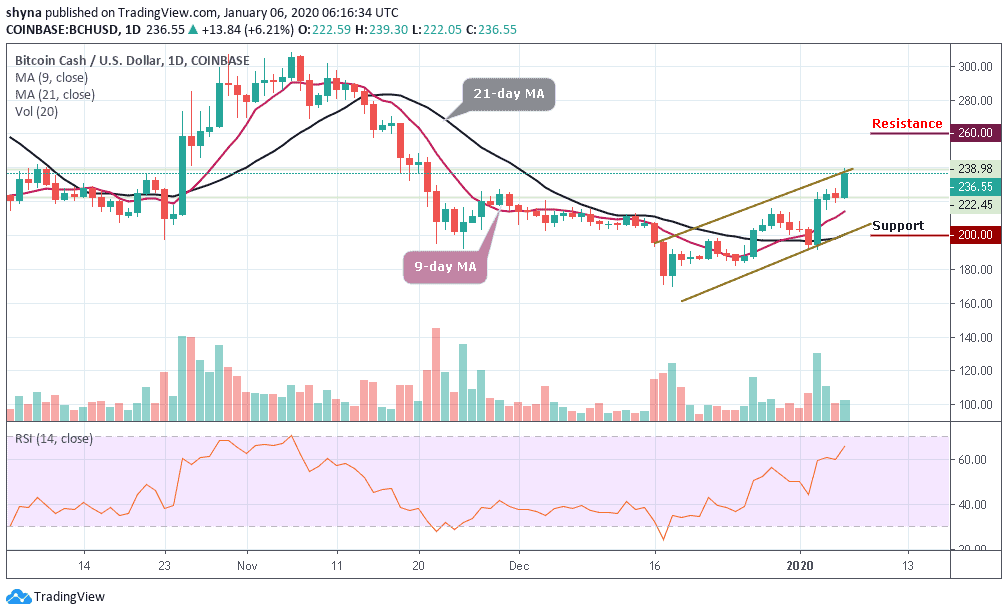
If the BCH/USD trading volume can continue to increase significantly, a bullish run is likely to occur. Following the recent price, Bitcoin Cash is currently facing a potential resistance at $240 level across the upper boundary of the channel. A break above the ascending channel is likely to produce a huge green candle to the upside, marking resistances at $260, $270, $280 levels and above. By then, the BCH market would have been in a bullish run.
As we can see in the daily chart, a bearish step back below the 9-day moving average may likely roll the market back to $210 support, if the bulls fail to hold this support, a possible break down to $200, $190 and $180 supports may be visited, and this may establish a new yearly low for the market.
Looking at the chart, we can see that the trading volume is rising, giving a sign of an upcoming big move. More so, the technical indicator, RSI (14) signal line is moving towards the overbought zone due to the price increase where a precise bullish cross might reveal more buy signals for the market.
BCH/BTC Market
Against BTC, the market bounces back 4 days ago to move above the 9-day and 21-day moving averages. Today, BCH eventually broke up the channel, which raised the price to 3169 SAT before the slight drop to 3140 SAT. Bitcoin cash has now signaled a bullish rally, likely to meet resistance at 3300 SAT and 3400 SAT if the pressure rises. In fact, the daily chart reveals that the technical indicator RSI (14) is now within the overbought zone.
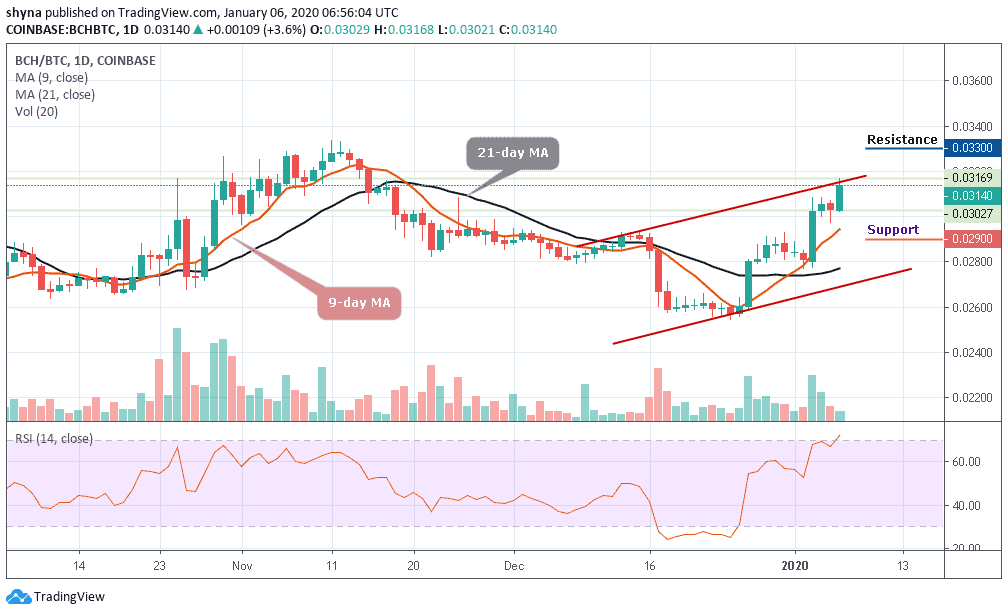
Meanwhile, from the market structure, we can say the bulls have regained control of the market. But BCH is likely to retrace to the break level around 3000 SAT where it consolidated yesterday. However, should Bitcoin Cash drops below this consolidation area, the price may find supports at 2900 SAT and 2800 SAT.
Please note: Insidebitcoins.com is not a financial advisor. Do your research before investing your funds in any financial asset or presented product or event. We are not responsible for your investing results.
Join Our Telegram channel to stay up to date on breaking news coverage