Join Our Telegram channel to stay up to date on breaking news coverage
BCH Price Prediction – October 23
Bitcoin Cash is back in the downtrend amid widespread declines in the crypto market. The coin is subtly in the red following the rejection from going above $235.
BCH/USD Market
Key Levels:
Resistance levels: $240, $245, $250
Support levels: $190, $185, $180

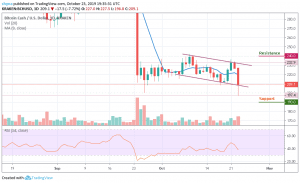
Looking at the daily chart, BCH/USD could no longer defend the support level of $210 again as the price hovers around $209. The coin is now moving below the 21-day moving average, indicating a bearish trend. For the time being, the market price is heading towards the lower boundary of the channel and the RSI (14) moves below the 40-level.
Furthermore, if the market drives below the $195 support, the BCH price could slump to $190, $185 and $180, bringing the price to a new low. Meanwhile, a strong buying pressure may need to take the price above the channel to $230 resistance. While trading at $230, a bullish continuation could likely to touch the $240, $245 and $250 resistance levels.
Now that the BCH/USD pair has rolled back beneath the October 2019 support at $210, especially below the lower channel trend line, we need to have a clear climb back above the support before we can confirm another bull-run. Otherwise, the BCH market may remain in its perpetual bearish condition.
Against Bitcoin, the price has made an attempt to rise against Bitcoin a few days ago but as it appeared, though trading above the 21-day MA, there’s a low amount of buying pressure in the market which is why the price slumped today. More so, the Bitcoin cash price is waiting for a break out above the channel which could push the market to the nearest resistance at 0.0295 BTC and above.
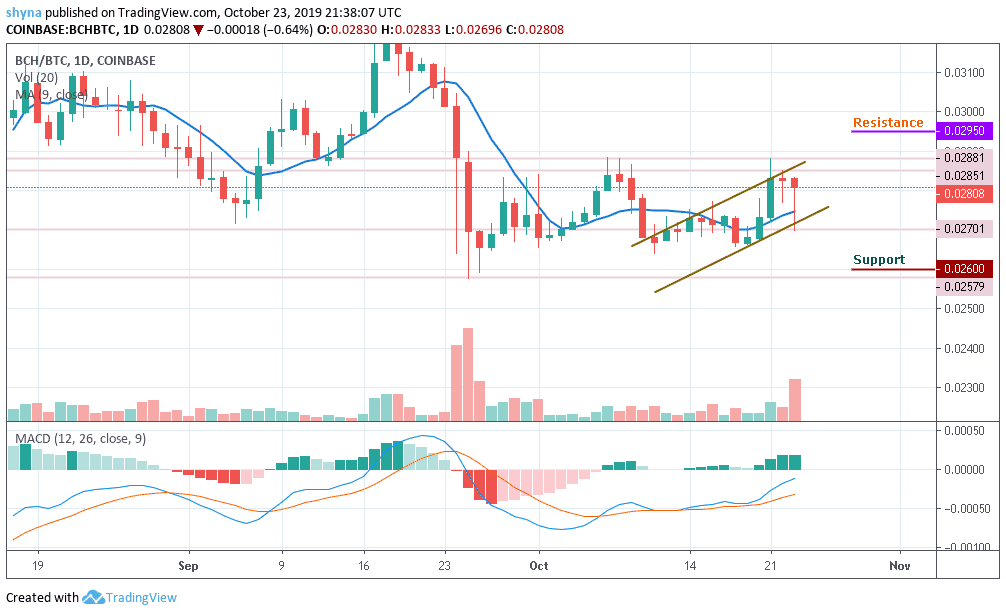
In other words, if the bulls fail to stop the selling pressure; the price may likely fall to the support level of 0.026 and while trading at this level, a breach could slump the market to another support of 0.025 BTC, creating a new low below the rising channel. Meanwhile, the trading volume is rising slowly while the MACD indicator is making an attempt to cross to the positive side by giving bullish signals.
Please note: Insidebitcoins.com is not a financial advisor. Do your research before investing your funds in any financial asset or presented product or event. We are not responsible for your investing results.
Join Our Telegram channel to stay up to date on breaking news coverage