Join Our Telegram channel to stay up to date on breaking news coverage
BCH Price Prediction – October 13
The Bitcoin Cash bulls come back low after the $229 rejection. The downward trend may remain strong despite the high volatility.
BCH/USD Market
Key Levels:
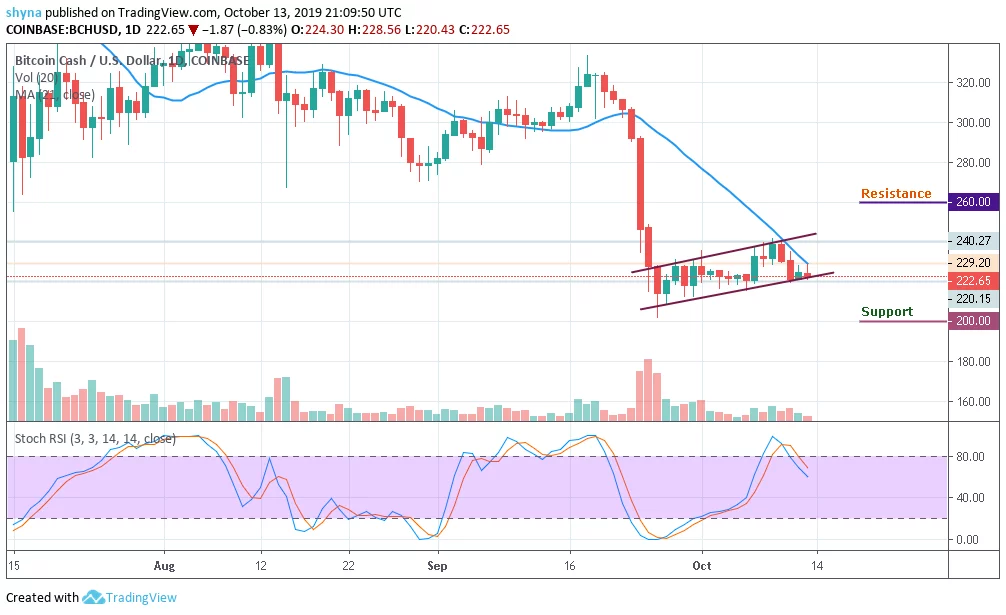
Resistance levels: $260, $270, $280
Support levels: $200, $190, $180
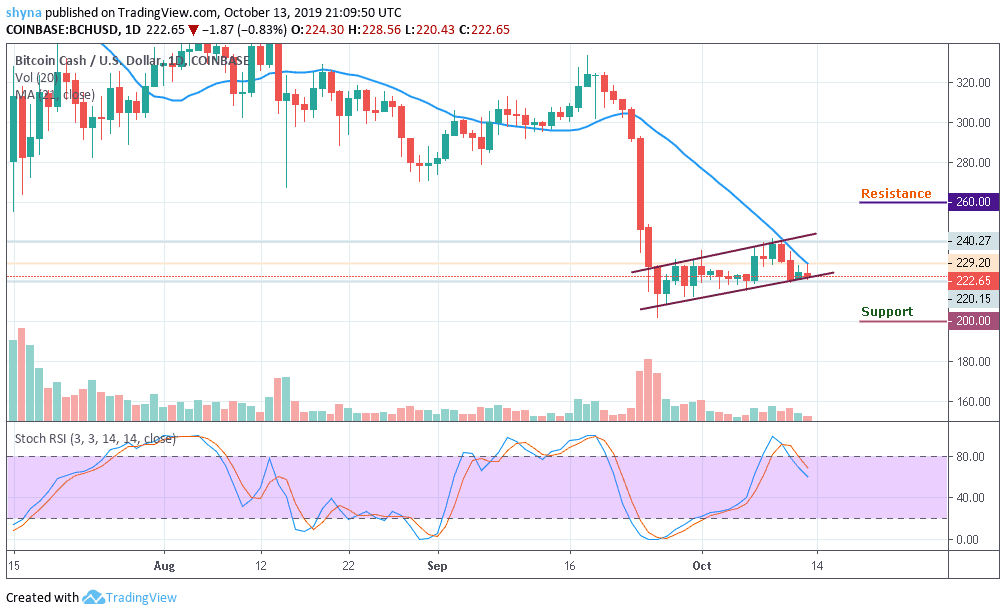
The BCH/USD price indicates an upward trend in the ascending channel market, falling below the 21-day moving average. A few days ago, it was revealed that BCH evolves at a high speed on the market but currently the market is planning a volatile move in which Bitcoin Cash moves moderately. The BCH market should soon come out of the phase and the coin is also making an effort to regain its initial momentum over time.
In addition, the price of the BCH is trading at $222.65 and still moving at the lower boundary of the channel but any fall below the trend line of the ascending channel could bring the price to the support levels of $200, $190, and $180. On the upside, a sustained move above $230 at the 21-day moving average could ease the initial downside pressure and create momentum for the bulls with the focus to move the market to the next resistance levels of $260, $270 and $280 respectively.
Looking at the daily chart, the stochastic RSI is currently looking bearish as the trading volume is becoming low due to the recent drop in Bitcoin dominance. Meanwhile, the traders may expect more drop if the bears inject more pressure in the market.
Against Bitcoin, as revealed in the daily chart, the bears have shown a little commitment to BCH trading. Following the recent negative sign, the trend may continue to go down if the sellers can continue the pressure further.
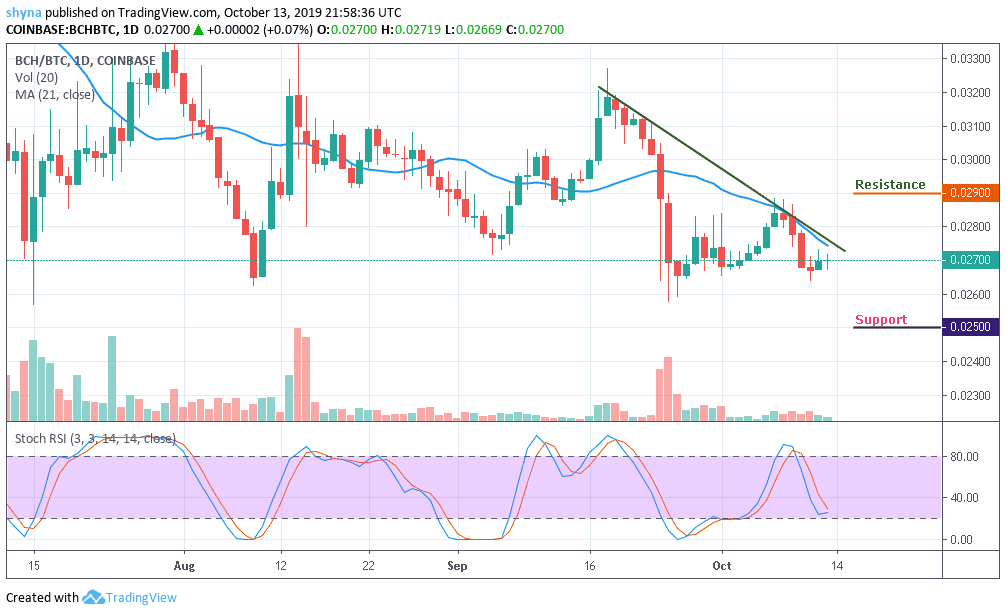
More so, as the stochastic RSI is hovering around level 28, if the buyers can hold the support of 0.026 BTC, the market price may likely resume an upward trend and cross the moving average of 21-day to touch the resistance level of 0.029 BTC and 0.030 BTC but a retest could lower the price to 0.025 BTC and 0.024 BTC support levels.
Please note: Insidebitcoins.com is not a financial advisor. Do your research before investing your funds in any financial asset or presented product or event. We are not responsible for your investing results.
Join Our Telegram channel to stay up to date on breaking news coverage