Join Our Telegram channel to stay up to date on breaking news coverage
BCH Price Prediction – March 13
There appears to be a tight-increasing effort in the market value of BCH as paired with the US Dollar’s worth. It is recalled that the crypto’s value dropped recently to locate support almost half point between $500 and $400 levels.
BCH/USD Market
Key Levels:
Resistance levels: $650, $750, $850
Support levels: $450, $400, $350
BCH/USD – Daily Chart
The BCH/USD trading chart shows that the crypto-market value is getting set for another upsurge on a slow-moving outlook. As at the time of writing, a real-body bullish candlestick is forming a bit away from the smaller SMA trading indicator. The bullish trend-line has drawn to place at a support line of $500 mark. The 50-day SMA trend-line is located nearer underneath the point mentioned earlier as the 14-day SMA trading indicator is positioned above them with a small distance. The Stochastic Oscillators have moved into the overbought region to close the hairs within it. That could mean a feature of getting to see a kind of price consolidation moves soon in the crypto-market.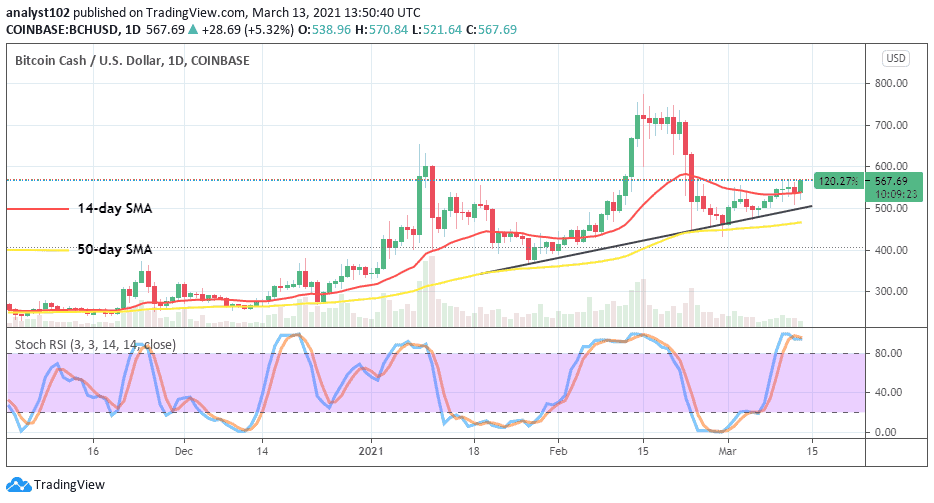
Do the BCH/USD bulls now have the energy to push northwardly?
The potential of the BCH/USD bulls breaking past a near resistance value of $600 seems not to have completely lost as there appears to be a promising bullish formation of a trading candlestick currently in the market. In what may look as also having a price consolidation moving mode in a near time, the bulls are expected to push further northward even there could be little falls towards the support line of $500.
On the downside, the BCH/USD bears have to mount a pressure between the levels of $600 and $700 to resist a smooth journey of the crypto-market to the north afterward. Meanwhile, a line of some price rejection around $800 and $900 points will lead to another decline which may, in turn, termed a retracement move of the market. However, all that said, those assumed scenarios may not easily come by in near trading conditions. 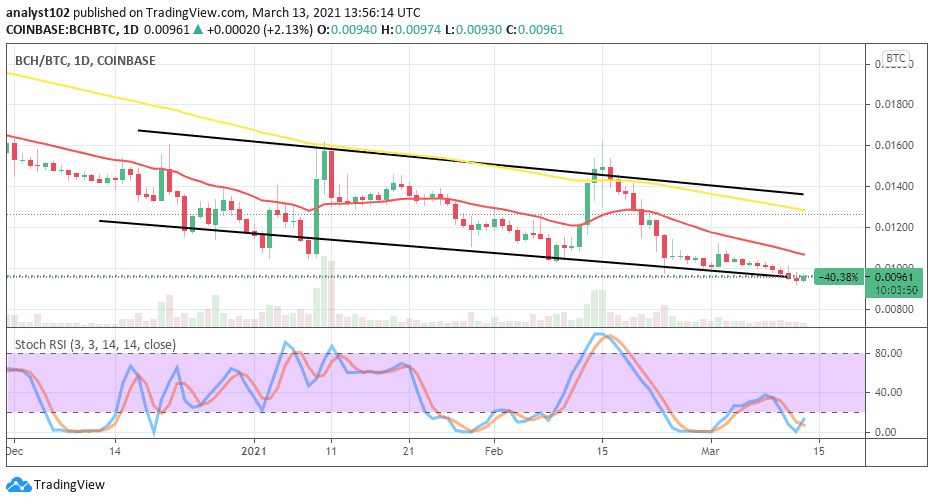
BCH/BTC Price Analysis
As regards weighing or valuing the market trading position between BCH and BTC, it still shows that the counter-instrument has stronger purchasing power than its base-tool. However, the counter-crypto’s power appears getting exhausted as final downward pressures are seemingly staging from the lower bearish trend-line very soon. The 14-day SMA and the 50-day SMA trading indicators are located above the market price level. The Stochastic Oscillators have dipped into the oversold region to cross the hairs within it briefly to the north. That suggests that there may soon be a rebound or rally movement featuring between the two trade instruments.
Join Our Telegram channel to stay up to date on breaking news coverage