Join Our Telegram channel to stay up to date on breaking news coverage
BCH Price Prediction – May 13
The Bitcoin Cash price is consolidating below a key resistance level; traders may need to watch out for a breakout.
BCH/USD Market
Key Levels:
Resistance levels: $280, $300, $320
Support levels: $190, $170, $150
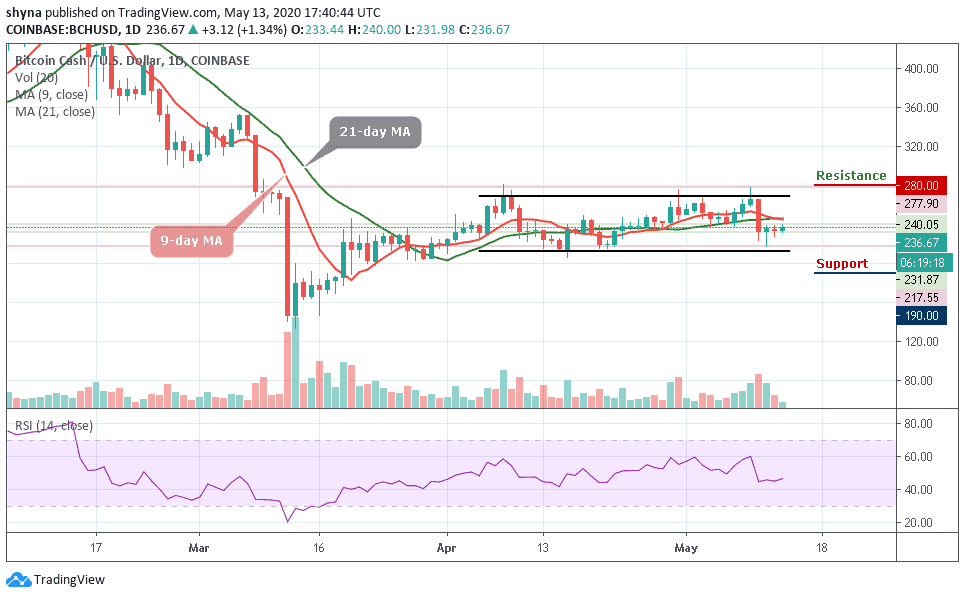
Looking at the daily chart, BCH/USD is ranging in the long-term outlook. The Bitcoin Cash price remains within the ranging zone. Meanwhile, the resistance level of $240 continues to be a strong barrier to the bulls while the support level of $227 has not been able to break down by the bears.
In addition, BCH price is hovering around $236.67 below the 9-day and 21-day moving averages within the channel while the two moving averages remain interlocked to each other which indicates that consolidation is in progress in the BCH market. Nevertheless, an increase in the bulls’ momentum may lead to a breakout at the resistance level of $260 and this may expose the movement to the resistance levels of $280, $300, and $320.
In other words, if there is a breakout at the support level of $210, it may decrease the price to the supports of $190, $170, and $150. The technical indicator RSI (14) is above 45-level with the signal line parallel to the level, which indicates ranging movement in the market.
Against BTC, the market bounces back a few days ago to move above the 9-day and 21-day moving averages. Following the recent negative sign, the trend may continue to go down if the bears continue to pump more pressure into the market further. In fact, the technical indicator RSI (14) signal line is now facing the south by moving below the 35-level giving some bearish signals.
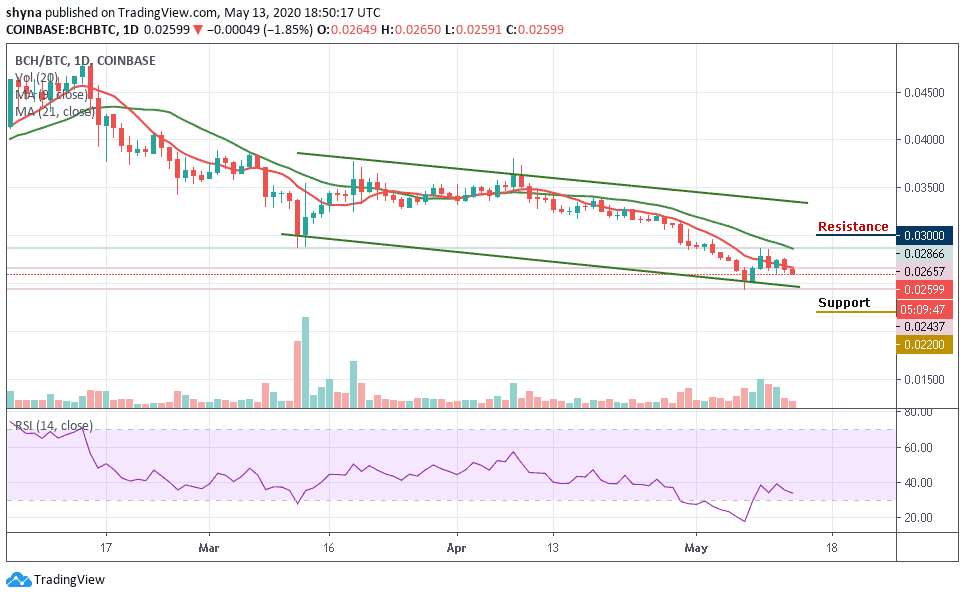
More so, if the buyers can hold the support at 0.026 BTC, the Bitcoin Cash price may likely resume an upward trend and cross above the 9-day and 21-day moving averages to touch the resistance level of 0.030 BTC and 0.032 BTC but facing a downward trend could lower the price to 0.022 BTC and 0.020 BTC support levels.
Please note: Insidebitcoins.com is not a financial advisor. Do your research before investing your funds in any financial asset or presented product or event. We are not responsible for your investing results.
Join Our Telegram channel to stay up to date on breaking news coverage