Join Our Telegram channel to stay up to date on breaking news coverage
BCH Price Prediction – August 2
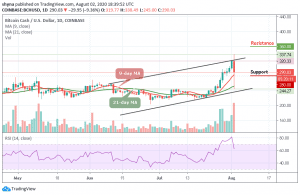
The Bitcoin Cash free-falls under the moving averages as the broad-based selling activities hit the market.
BCH/USD Market
Key Levels:
Resistance levels: $360, $380, $400
Support levels: $280, $260, $240

Despite maintaining a bullish movement for the past few weeks, it looks like BCH/USD is looking to slow down and settle around the $290 support level. However, the market price broke down today, touching its lowest daily level at $244.27. More so, the current performance of the coin is below the normal expectations of traders and the coin may soon recover from this downtrend.
Could There Be a Fresh Bearish Wave in BCH?
If the BCH price fails to break the trend line of the upper boundary of the channel, there is a risk for a fresh bearish wave. If the coin drops below the 9-day moving averages, initial support may be located at a $275 level where the market price could restart its decline.
What is the Next Direction for Bitcoin Cash?
As the technical indicator, RSI (14) reveals the sudden downtrend from the overbought region, any further bearish crossing below 60-level could lead to the critical supports at $280, $260, and $240. Nevertheless, a high swing could take the bulls to a key resistance level of $340. If this possible, the coin may trigger a bullish rally which could take the market price to $360, $380, and $400 resistance levels.
Against Bitcoin, the daily chart reveals that the sellers have started showing some commitment to BCH trading because of the recent rise of BTC. However, following the recent negative signs, the trend may continue to go down if the bears continue to put more pressure on the market.
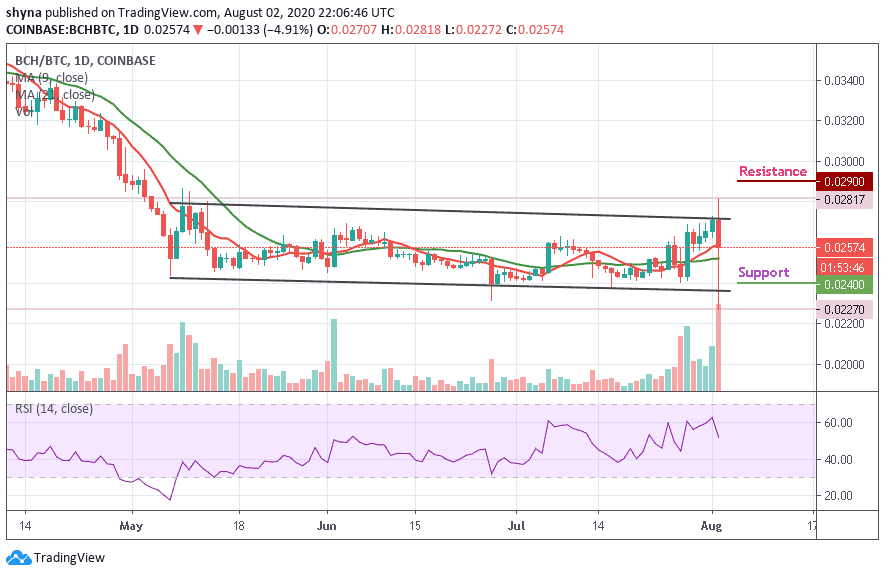
Moreover, as the RSI (14) signal line moves below 55-level, if the buyers failed to hold the support of 0.0257 BTC, the market price may likely focus on the downtrend, pushing it below 9-day and 21-day moving averages may bring it to the nearest supports at 0.0240 BTC and 0.0230 BTC but a rebound could take the price above the upper boundary of the channel to hit the resistance at 0.0290 BTC and 0.0300 BTC.
Join Our Telegram channel to stay up to date on breaking news coverage