Join Our Telegram channel to stay up to date on breaking news coverage
BCH Price Prediction – June 24
Bitcoin Cash (BCH) is seen trading at the lower level despite the fact that the price touches $245 resistance level.
BCH/USD Market
Key Levels:
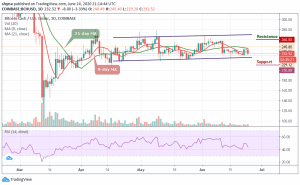
Resistance levels: $260, $280, $300
Support levels: $210, $190, $170
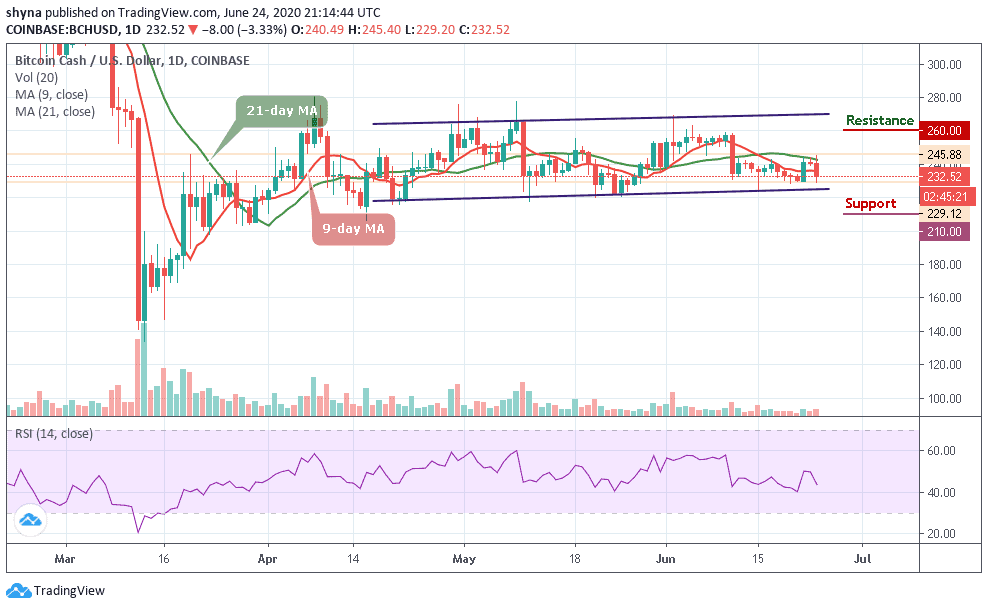
The BCH/USD peaked at $245.88 today and has been trying to maintain the trend as the price consolidates within the channel. Meanwhile, for the price not staying above $245 ruins the long-term technical picture of the coin. Bitcoin cash will have to hold this ground to guide against the downward pressure and the closest support expects the coin at $225, which is the June 15 low. Once it is eliminated, the downside may likely grow, with the next goal supporting $210, $190, and $170 levels.
However, the price of the Bitcoin Cash is trading at $232.52 and still evolving in-between the 9-day and 21-day moving averages. On the upside, a sustains move above $240 will ease the initial downside pressure and create momentum for the bulls with the focus to move the market to the next resistance levels of $260, $280. and $300 respectively. At the moment, RSI (14) is currently moving below 50-level, which indicates that the market might still visit the south.
Looking at the daily chart, we realize that the recent consolidation within the channel is necessary for the bullish action. Moreover, the support formed between $229 and $241 provided air-tight protection allowing the buyers to concentrate on stirring action to the north.
Meanwhile, compared with Bitcoin, when looking at the daily chart, following the trade for the past couple of days, the bulls have shown a little commitment to BCH trading. Following the recent positive sign, the trend may continue to go up if the buyers can sustain the pressure further.
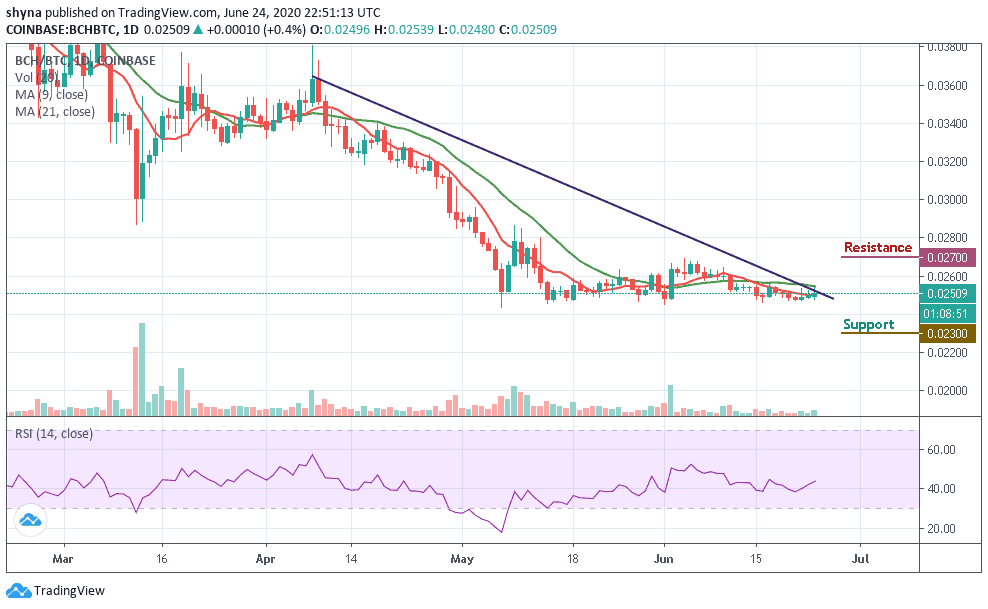
However, if the buyers succeeded in breaking the upper side of the channel, the market price may likely touch the next resistance level of 0.027 BTC and 0.028 BTC. In other words, a retest could lower the price to 0.023 BTC and 0.024 BTC support levels. With the look of things, the RSI (14) indicator moves above 43-level which may likely boost the bullish momentum.
Join Our Telegram channel to stay up to date on breaking news coverage