Join Our Telegram channel to stay up to date on breaking news coverage
BCH Price Prediction – November 26
Observing the movement of the BCH, the coin has been showing an uneven movement with several rises and falls.
BCH/USD Market
Key Levels:
Resistance levels: $240, $260, $280
Support levels: $180, $160, $140
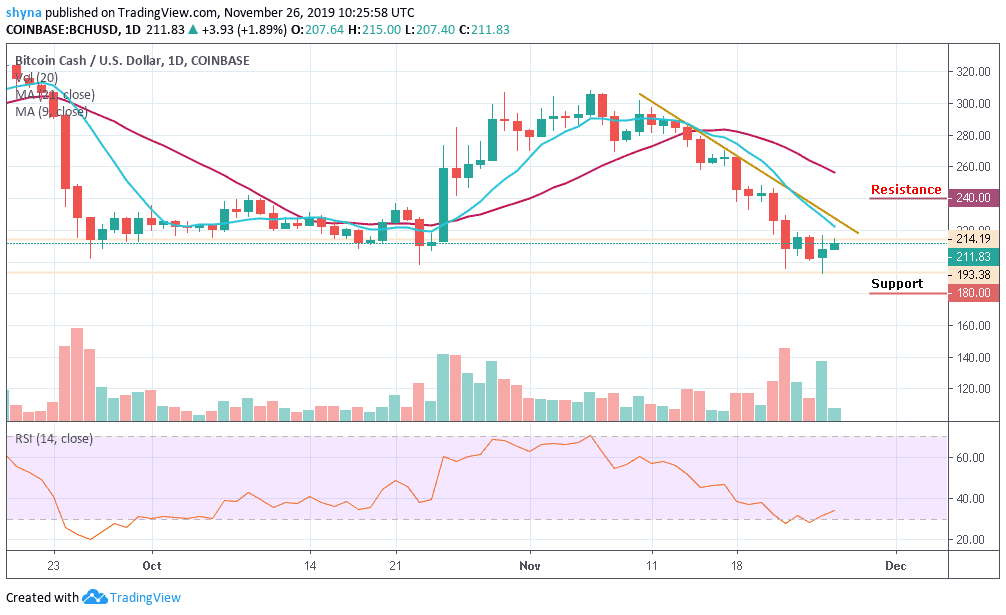
Since yesterday, BCH/USD seems to have picked up its pace and has risen above $205. However, if we observe the movement of Bitcoin Cash, the coin has been showing an uneven movement with several falls more than rises and it has not been able to maintain a consistent bullish run. Moreover, it may continue to show some signs of a downward movement slowly till the latter part of the day.
Furthermore, on the upside, the bulls are trying to push the price towards the initial resistance of $220 level, and if they are able to break above the trend line, the coin may likely reach the $240, $260 and $280 resistance levels. In other words, the primary support holds ground at $202 while $195 will try to stop overstretched losses in case of a reversal.
Nevertheless, if the market drives below the $190 support, THE BCH price could slump to $180, $160 and $140, bringing the price to a new monthly low. Meanwhile, the RSI (14) is recovering from the oversold territory and this indicates that the bulls are likely to step back into the market.
A few days ago, the Bitcoin Cash has been making an attempt to rise against Bitcoin but as it appeared, there’s a low amount of buying pressure in the market which is why the price dropped again yesterday. The BCH price broke the trend line of the ascending channel and touched the resistance level of the 3083 SAT.
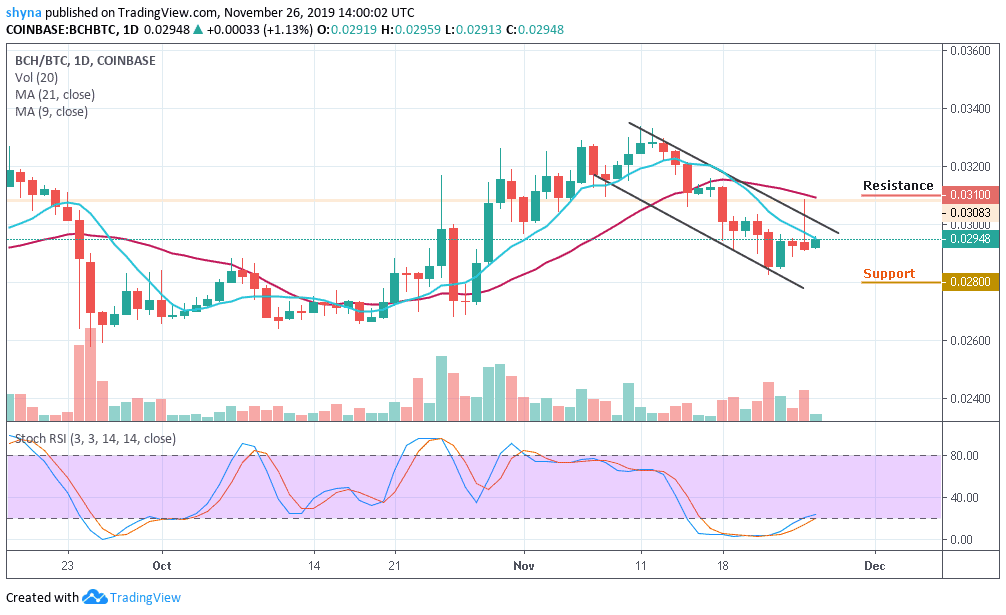
Moreover, as the bulls are trying to stop the selling pressure; the resistance in this range is at 3100 SAT and above while the support is at 2858 SAT, a bearish continuation may touch 2800 SAT and 2700 SAT supports. Furthermore, a breach could slump the market to 2600 SAT support, creating a new low below the falling channel. The Stochastic indicator is moving out of the oversold territory, which indicates more bullish signals.
Please note: Insidebitcoins.com is not a financial advisor. Do your research before investing your funds in any financial asset or presented product or event. We are not responsible for your investing results.
Join Our Telegram channel to stay up to date on breaking news coverage