Join Our Telegram channel to stay up to date on breaking news coverage
Key Points
- Bitcoin cash price failed to move past the $580-600 resistance and tumbled against the US Dollar.
- There was a break below a key bullish trend line with support at $500 on the hourly chart of the BCH/USD pair (data feed from Kraken).
- The pair traded below the $475 level and it is currently correcting higher towards $500-510.
Bitcoin cash price traded sharply lower below $500 against the US Dollar. BCH/USD could correct higher, but it remains sell on rallies near $510 and $530.
Bitcoin Cash Price Decline
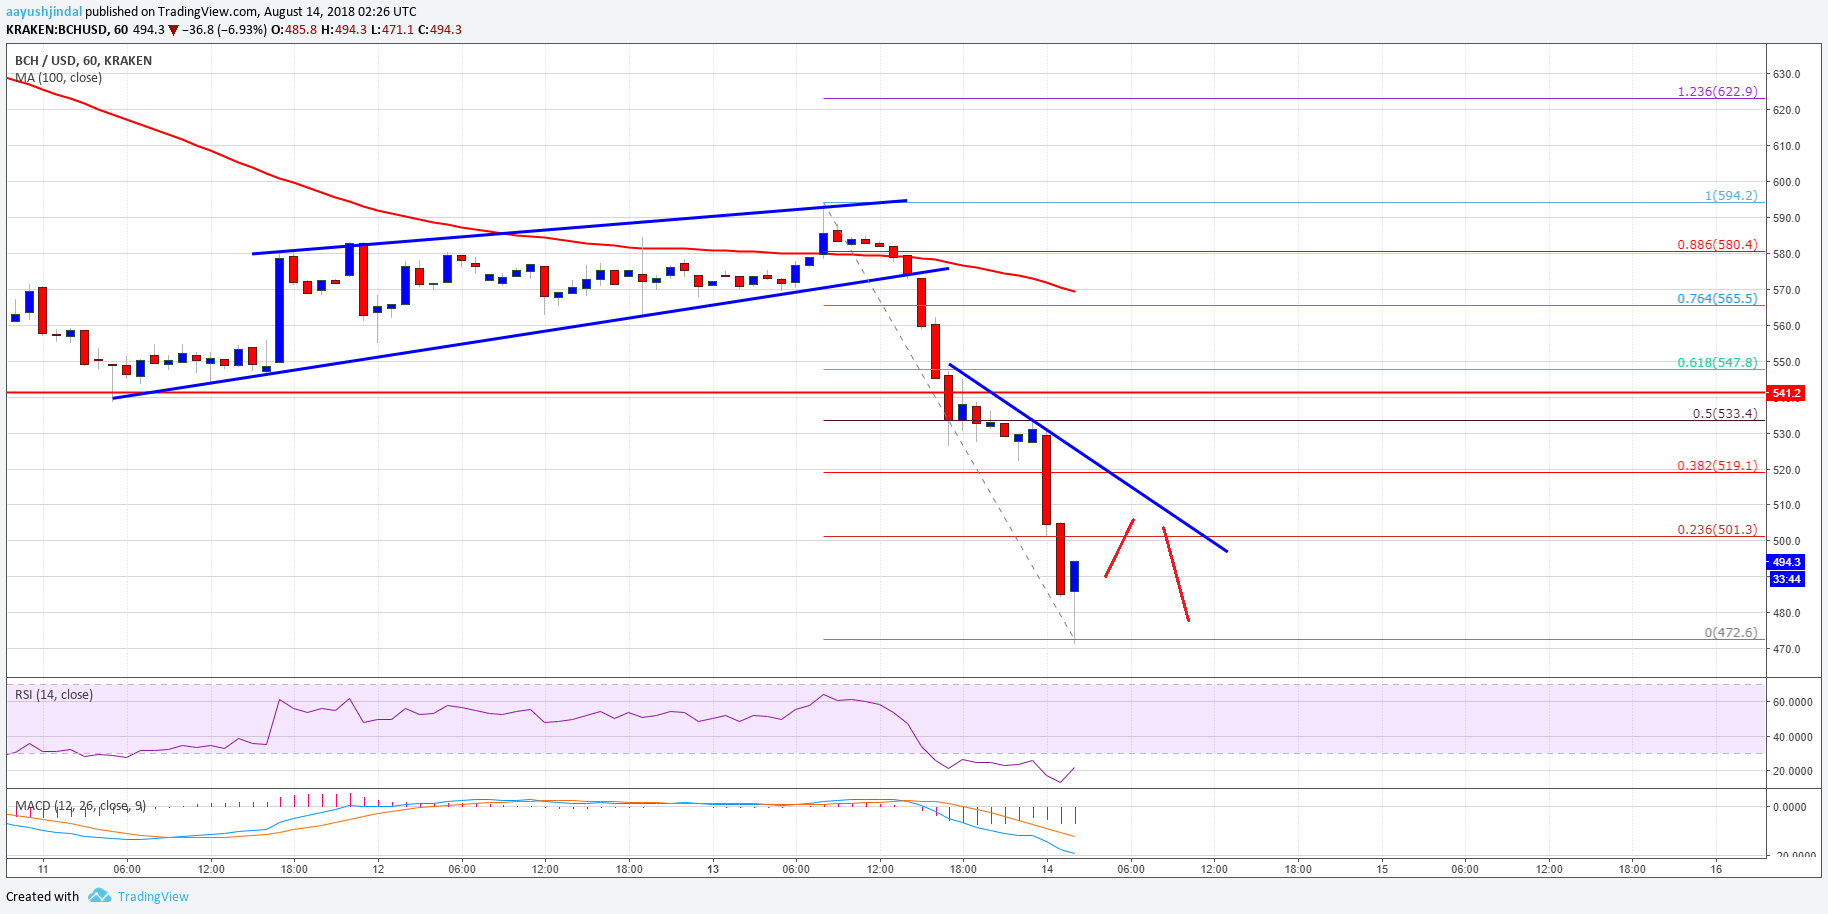
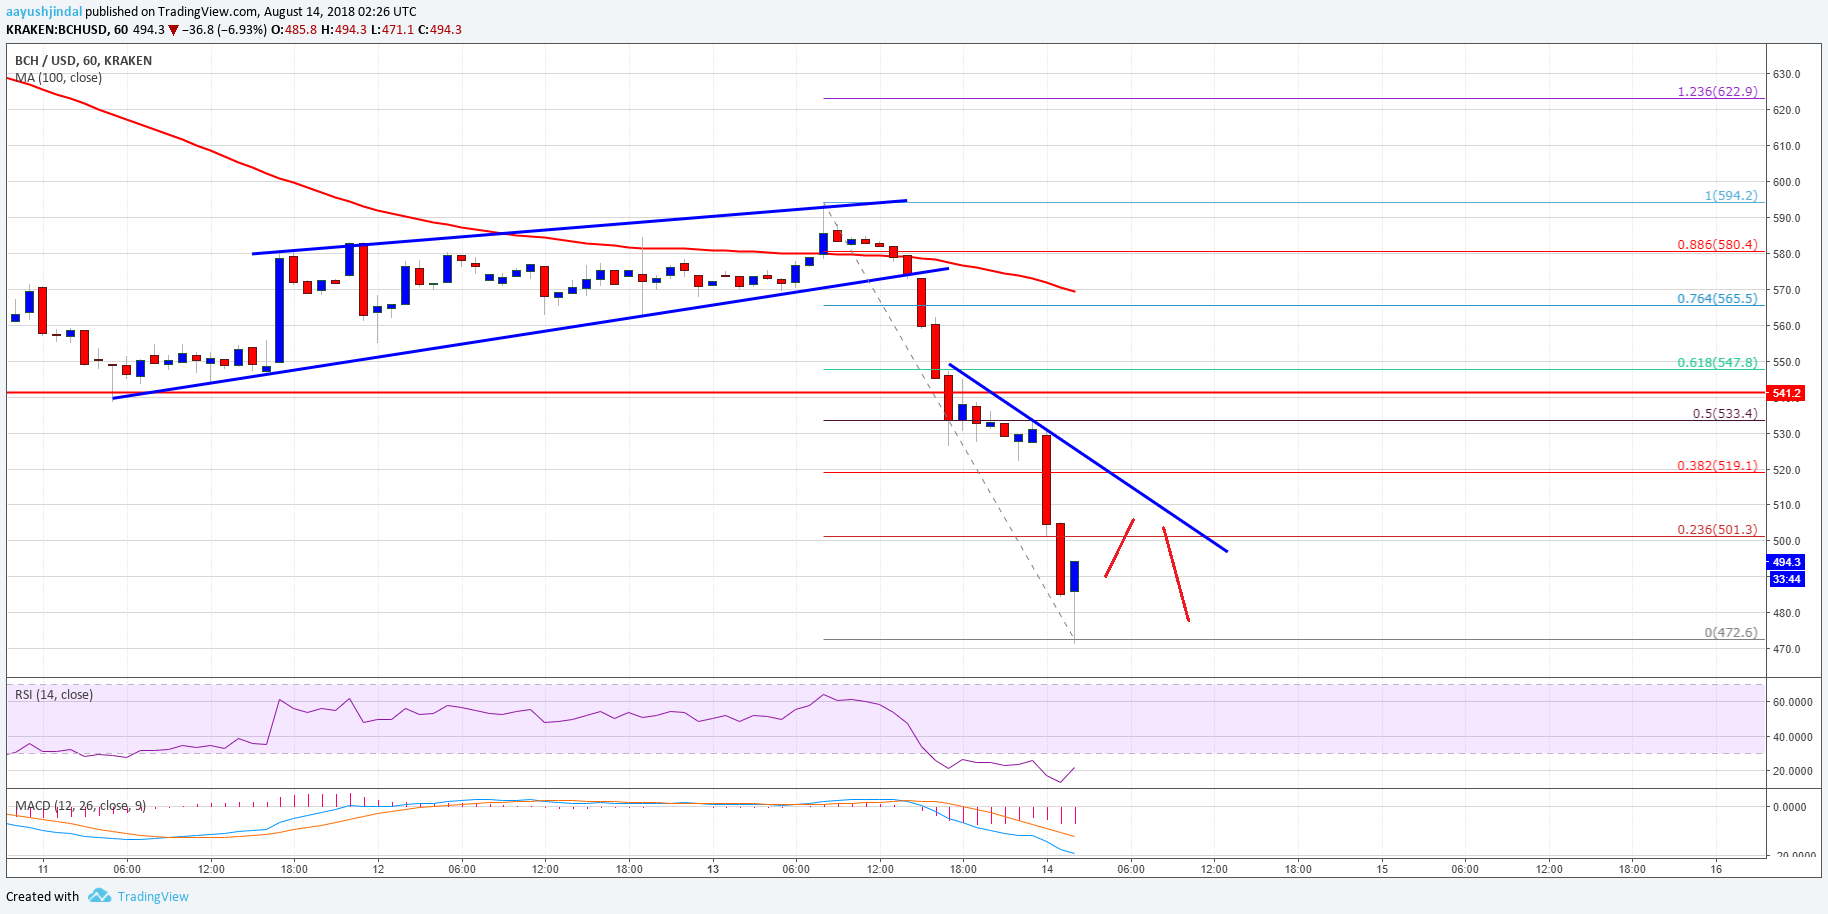
Yesterday, bitcoin cash price made an attempt to break the $580 and $600 resistance levels against the US Dollar. The BCH/USD pair failed to move past $600, which resulted in a bearish reaction. The price dropped abruptly and broke many supports such as $550 and $520. It even settled below the $520 pivot level and the 100 hourly simple moving average.
Moreover, there was a break below a key bullish trend line with support at $500 on the hourly chart of the BCH/USD pair. The pair finally broke the $500 support and traded towards the $470 level. A new yearly low was formed at $472 and the price is currently correcting higher. An initial resistance is near the 23.6% Fib retracement level of the last drop from the $594 high to $472 low. There is also a connecting bearish trend line in place with resistance at $510 on the same chart. Above the trend line, the next hurdle is near $530. It coincides with the 50% Fib retracement level of the last drop from the $594 high to $472 low.
Looking at the chart, BCH price could correct a few points towards $500 and $510. However, upsides are likely to be capped near $510 and $530.
Looking at the technical indicators:
Hourly MACD – The MACD for BCH/USD is gaining pace in the bearish zone.
Hourly RSI (Relative Strength Index) – The RSI for BCH/USD is slightly recovering from the oversold levels.
Major Support Level – $475
Major Resistance Level – $530
The post Bitcoin Cash Price Analysis: BCH/USD Tumbles, Sell on Rallies appeared first on NewsBTC.
Join Our Telegram channel to stay up to date on breaking news coverage


