Join Our Telegram channel to stay up to date on breaking news coverage
Key Points
- Bitcoin cash price failed to move higher and declined below the $440 support against the US Dollar.
- Yesterday’s highlighted key bullish trend line was breached with support at $442 on the hourly chart of the BCH/USD pair (data feed from Kraken).
- The pair remains is currently trading below the $450 resistance and the 100 hourly simple moving average.
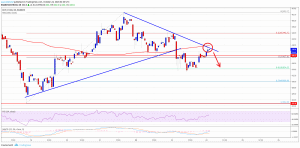
Bitcoin cash price is still struggling to clear $450 against the US Dollar. BCH/USD could slide once again towards $435 and $430 to fill buy orders.
Bitcoin Cash Price Analysis
There was another attempt to break the $450 resistance by bitcoin cash price against the US Dollar. The BCH/USD pair failed to gain momentum above $450 and started a downside move. The price declined below the $440 support and settled below the 100 hourly simple moving average. Moreover, there was a break below the 50% Fib retracement level of the last leg up from the $423 swing low to $452 high.
More importantly, yesterday’s highlighted key bullish trend line was breached with support at $442 on the hourly chart of the BCH/USD pair. The pair declined towards the $435 support where buyers emerged. Moreover, the 61.8% Fib retracement level of the last leg up from the $423 swing low to $452 high acted as a support. The price recovered slightly, but it is still trading well below the $450 level. There is a new connecting bearish trend line in place with resistance at $442 on the same chart.
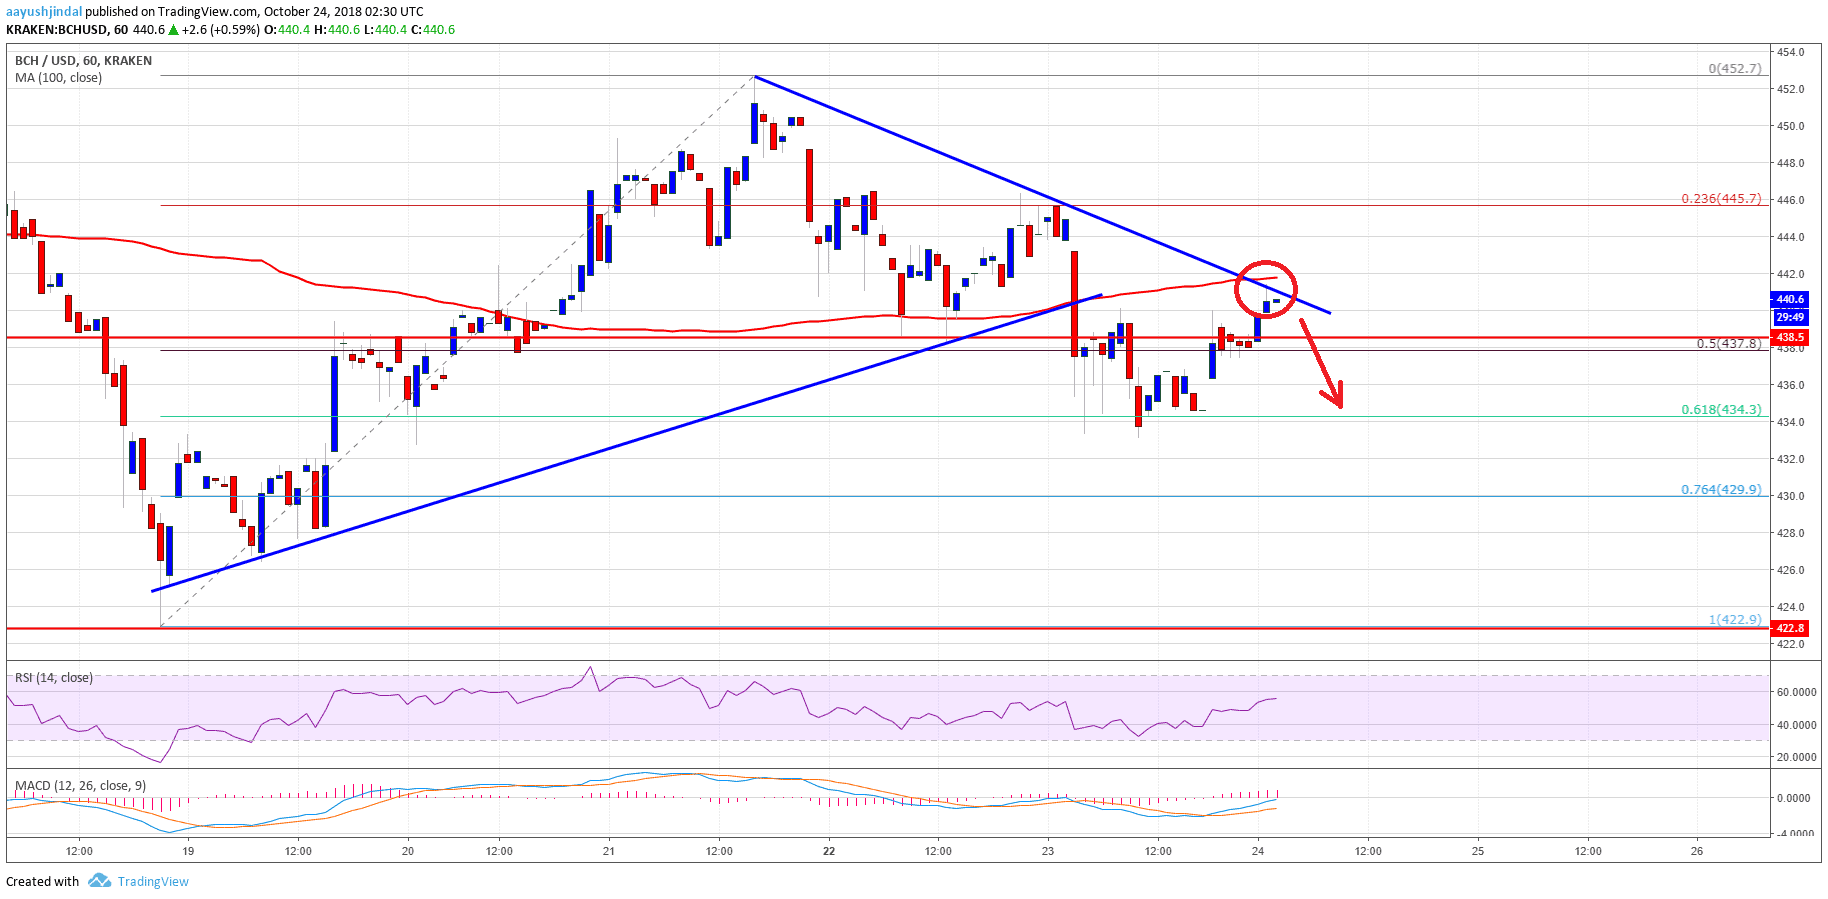
Looking at the chart, BCH price is currently under pressure below the $450 resistance and the 100 hourly simple moving average. Therefore, there could be another dip towards the $430 or $435 support before the price recovers above the $450 level.
Looking at the technical indicators:
Hourly MACD – The MACD for BCH/USD is slowly moving in the bullish zone.
Hourly RSI (Relative Strength Index) – The RSI for BCH/USD has managed to move above the 50 level.
Major Support Level – $435
Major Resistance Level – $450
The post Bitcoin Cash Price Analysis: BCH/USD Struggle Continues Near $450 appeared first on NewsBTC.
Join Our Telegram channel to stay up to date on breaking news coverage