Join Our Telegram channel to stay up to date on breaking news coverage
Key Points
- Bitcoin cash price dipped sharply and retested the $410 support area against the US Dollar.
- There was a break above a connecting bearish trend line with resistance at $415 on the hourly chart of the BCH/USD pair (data feed from Kraken).
- The pair could correct lower towards $418 or $415 before it can recover further in the near term.
Bitcoin cash price dipped and then recovery quickly above $420 against the US Dollar. BCH/USD could trade towards the $430 or $440 resistance in the short term.
Bitcoin Cash Price Analysis
Yesterday, bitcoin cash price failed to settle above the $420-422 zone against the US Dollar. The BCH/USD pair dipped sharply and retested the $408-410 support area where buyers emerged. The price found a strong buying interest near $410, resulting in a sharp upward move. Buyers pushed the price back above the $415 and $420 resistance levels.
Moreover, there was a break above a connecting bearish trend line with resistance at $415 on the hourly chart of the BCH/USD pair. The pair tested the $430 resistance zone and the 100 hourly simple moving average. Buyers struggled to push the price above the $430 level, resulting in a short term correction. The pair moved below the 23.6% Fib retracement level of the recent wave from the $407 low to $429 high. It seems like there could be more declines, but buyers are likely to protect the $418 and $415 support levels. Besides, the 50% Fib retracement level of the recent wave from the $407 low to $429 high is also near $418.
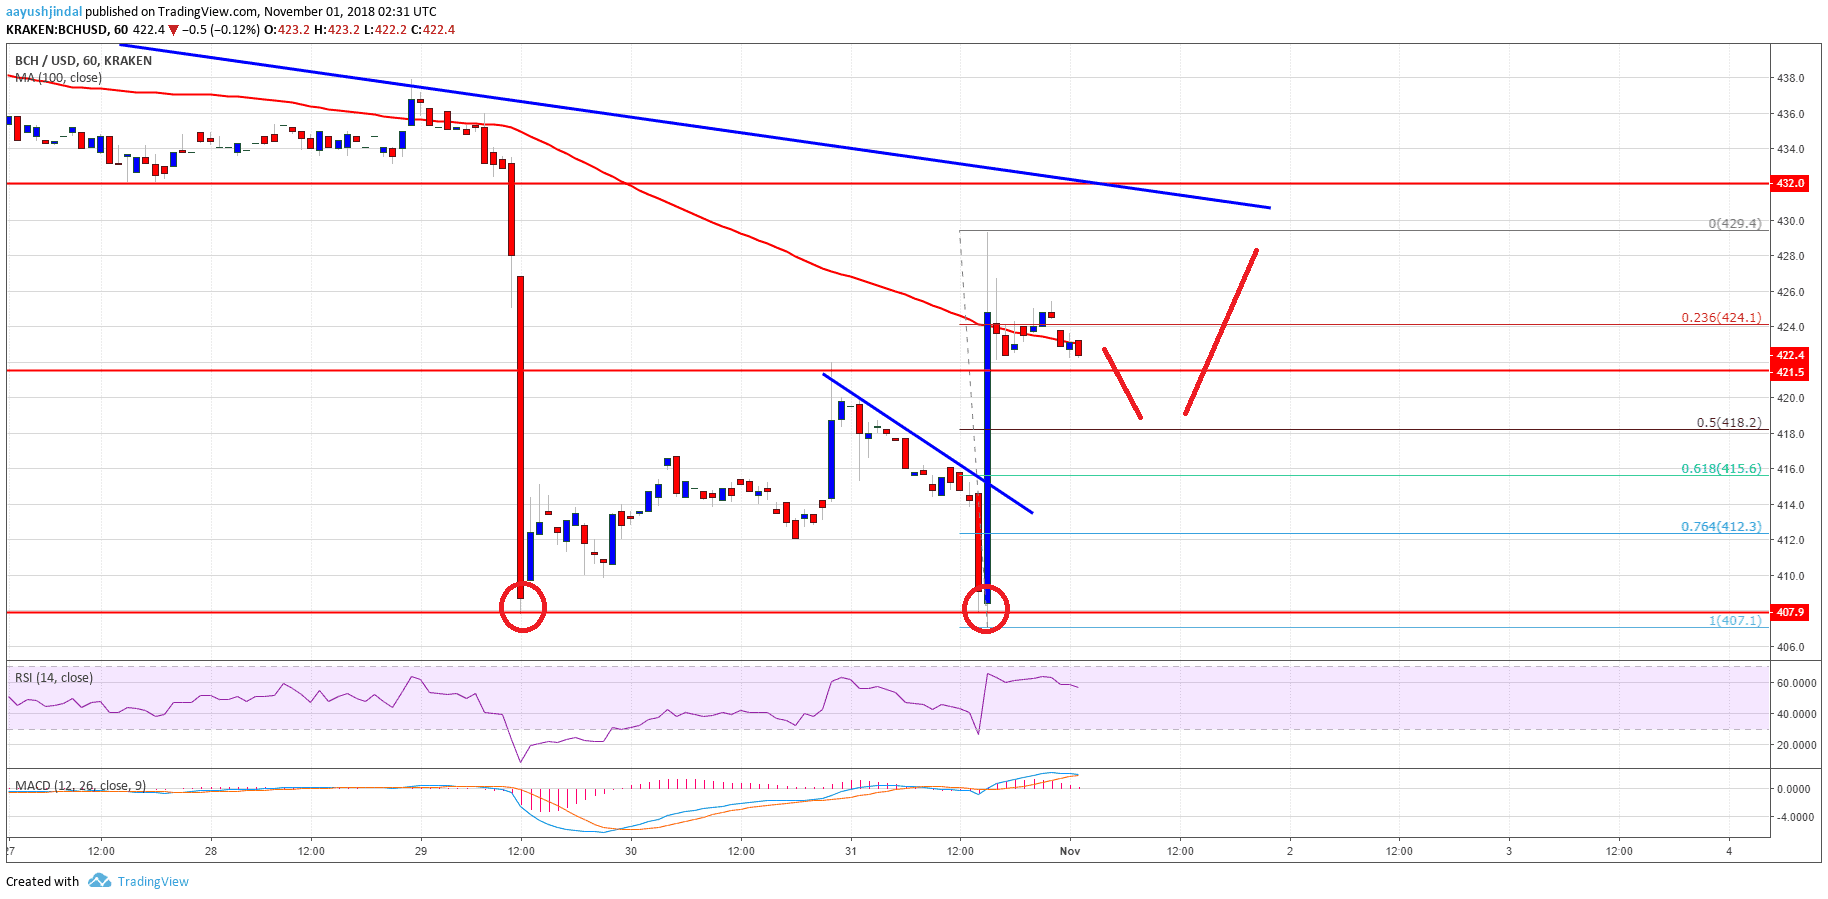
Looking at the chart, BCH price is forming a decent support near the $410 level. As long as the price is above $407, it could make another attempt to surpass $430.
Looking at the technical indicators:
Hourly MACD – The MACD for BCH/USD is slightly placed in the bullish zone.
Hourly RSI (Relative Strength Index) – The RSI for BCH/USD is well above the 50 level.
Major Support Level – $415
Major Resistance Level – $430
The post Bitcoin Cash Price Analysis: BCH/USD Formed Double Bottom Near $400 appeared first on NewsBTC.
Join Our Telegram channel to stay up to date on breaking news coverage