Join Our Telegram channel to stay up to date on breaking news coverage
Bitcoin (BTC) Price Prediction – September 30, 2020
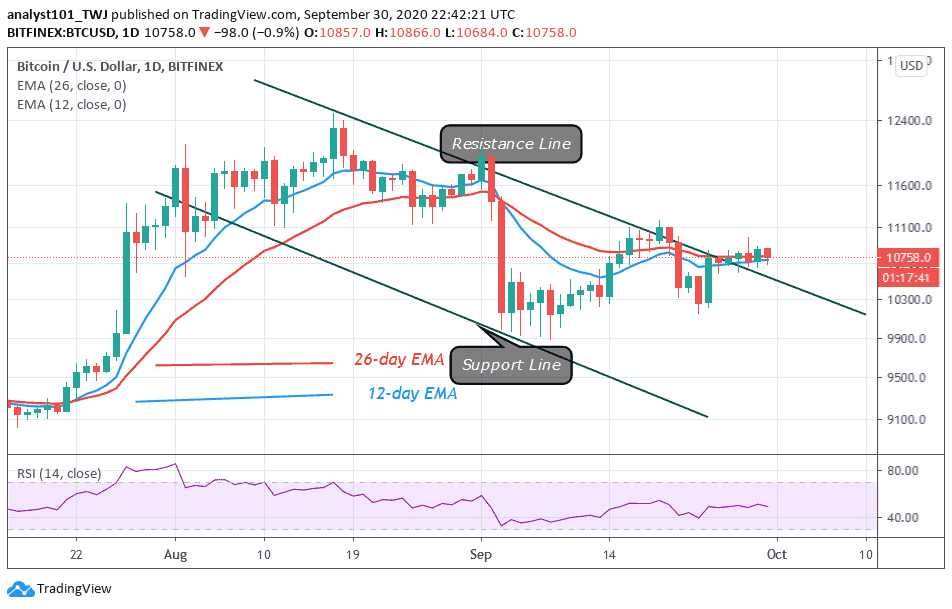
Bitcoin is range-bound above the $10,700 support. As price consolidates, BTC is trading marginally above the range-bound zone. In the previous price action, the resistances at $10,880 and $11,000 have kept BTC from trending higher.
Resistance Levels: $10,000, $11, 000, $12,000
Support Levels: $7,000, $6,000, $5,000

Since September 24, BTC/USD rebounded and resumed consolidation above the $10,700 support. The price action is characterized by small body candlesticks called Doji and Spinning tops. The candlesticks explain that buyers and sellers are in a period of indecision. They are undecided about the direction of the market. As price continues to consolidate, BTC can rebound above the current support.
A strong bounce will be sufficient to break the resistance at $10,880. Possibly, the momentum will extend to retest the $11,000 resistance. Alternatively, a breakout at the $11,000 resistance will end the current range-bound movement. At this point, the market will rally above $11,500 and subsequently hit the $12,000 overhead resistance. However, if BTC fails to rebound, the current price fluctuations will linger on.
Bitcoin Indicator Reading
Bitcoin is at level 49 of the Relative Strength index period 14. As the price is at the midpoint, it shows a clear balance between supply and demand. The EMAs are horizontally flat and suggest that the market is range-bound that can lead to a breakout or breakdown of prices.

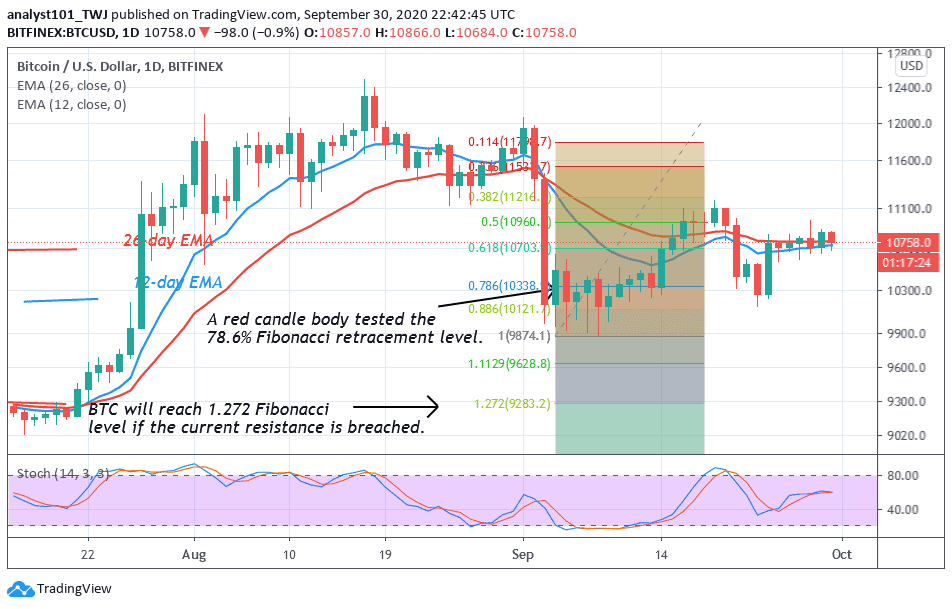
As the market continues its consolidation above $10,700, it is uncertain where the market will trend. As the bulls failed to break into previous highs, there is a tendency for the bears to attempt the psychological support at $10,000. In recent times, the bulls have defended the support at $10,000. However, if the bears break the $10,000 or $9,800 support, the Fibonacci tool analysis will hold. That is, Bitcoin will reach the low 1.272 Fibonacci extension of $9,283.20 low.
Join Our Telegram channel to stay up to date on breaking news coverage

