

Join Our Telegram channel to stay up to date on breaking news coverage
Bitcoin (BTC) Price Prediction – September 19, 2020
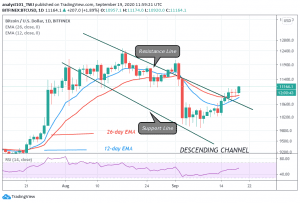
BTC/USD price is yet to break the $11,000 resistance as price fluctuates between $10,800 and $11,000. The current range will persist as long as buyers sustain price above the $10,800 support. Buyers have not been able to break the resistance because of strong defense by the bears.
Resistance Levels: $10,000, $11, 000, $12,000
Support Levels: $7,000, $6,000, $5,000
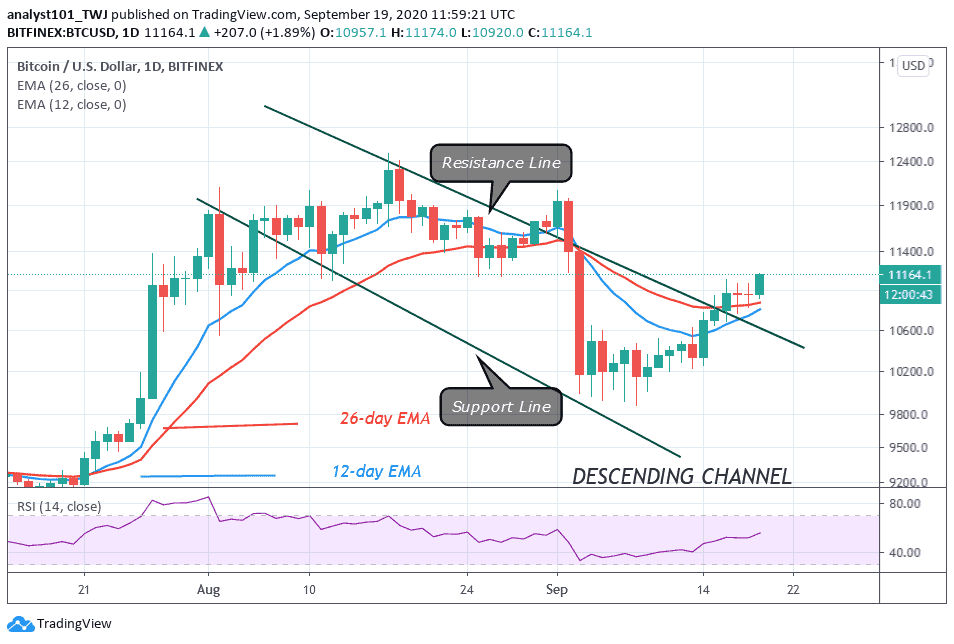
For the past four days, buyers have not been able to break the $11,000 resistance. The clearance of this resistance is crucial to BTC’s upward move. On the upside, if buyers sustain the price above $10,800, a retest at the resistance is possible. When a resistance faces several retests that resistance will be become weakened. Eventually, if price breaks above the $11,000, the first support will be $11,150.
The momentum will extend to the $11,600 where the resistance at $12,000 will be the next target. Conversely, if the bears succeed in breaking below the $10 800 support, the upside momentum will be interrupted. BTC price will fall to $10.625 or $10,500 low. Gradually, the bears will take advantage to retest the $10,000 support. Meanwhile, BTC is attempting to break above the $11,000 resistance. The king coin is at level 53 of the Relative Strength Index period 14. It indicates that BTC is in the uptrend zone.
EU to Ensure Complete Crypto Regulation by 2024
The European Union intends to incorporate crypto and blockchain technology into its main processes by 2024. This is on the backdrop of the COVID-19 pandemic which has necessitated digital payments across the globe. Also, many countries are looking toward Central Bank digital currencies to streamline their payment infrastructures. According to the internal document released by Reuters as reported on Friday which states: “By 2024, the EU should put in place a comprehensive framework enabling the uptake of distributed ledger technology (DLT) and crypto-assets in the financial sector […] It should also address the risks associated with these technologies.”
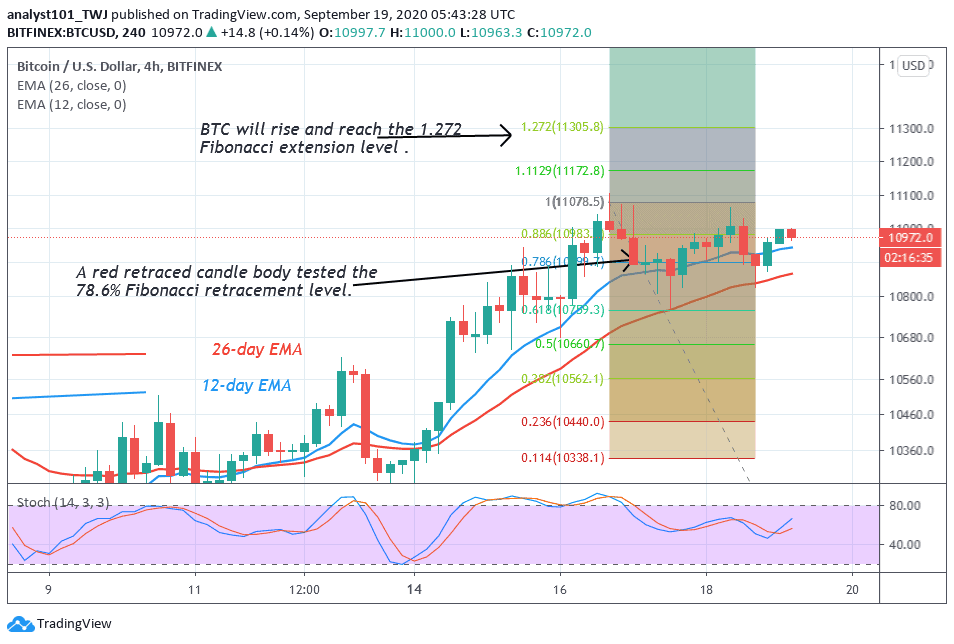
Today, buyers hit the $11,000 resistance and are sustaining the uptrend above it. On the 4 –hour chart, BTC reached the high $11,100 on September 16. The retraced candle body tested the 78.6% Fibonacci retracement level. This indicates that the market will rise and reach the 1.272 Fibonacci extension level or $11,300 high. However, the BTC price will reverse to the 78.6% retracement level where it originated. Thereafter, the price action will continue the upside momentum.
Join Our Telegram channel to stay up to date on breaking news coverage
