

Join Our Telegram channel to stay up to date on breaking news coverage
Bitcoin (BTC) Price Prediction – October 31, 2020
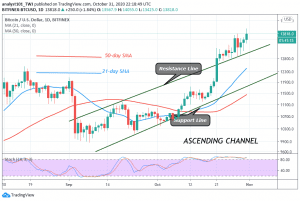
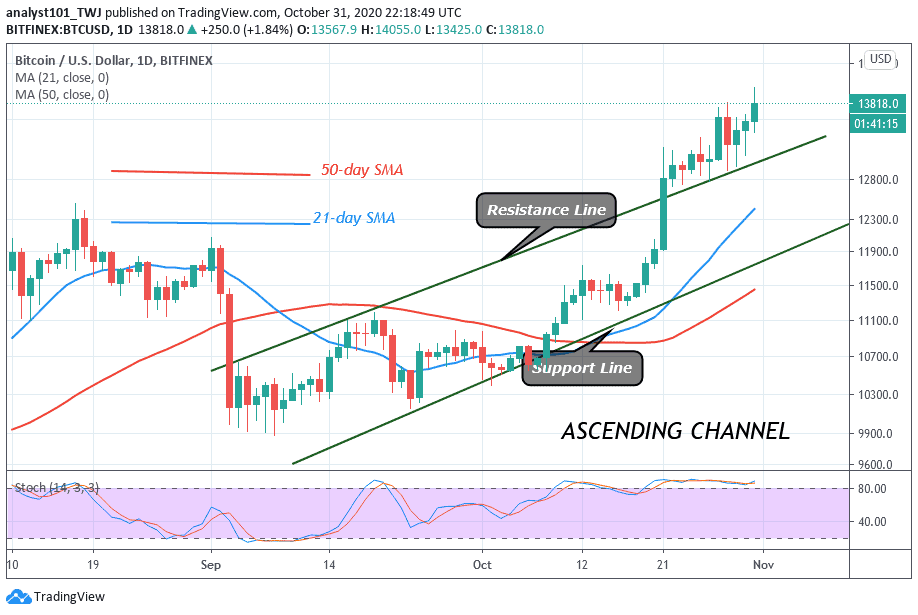
BTC/USD now trades below the $14,000 resistance. The king coin pulls back each time it retests the current resistance. The crypto has continued to sustain above the simple moving averages. This is responsible for the upside momentum.
Resistance Levels: $13,000, $14,000, $15,000
Support Levels: $7,000, $6,000, $5,000
On October 21, after breaking above the $12,000 and $12,460 resistance, the upside momentum was maintained consistently on the 4-hour chart. At that point, the price is making a series of higher highs and higher lows. Today, because of the rejection at the $14,000 resistance, the price has fallen to the range-bound zone of $13,060 and $13,800. BTC price was earlier struggling to break the resistance at $13,800. After that, the range-bound movement narrowed to $13.060 to $13,600.
At this narrow range, a breakout occurred to clear the resistances at $13,600 and $13,800. The bullish momentum continued to retest the resistance at $14,000.The market has returned to the original price range of $13,060 and $13,800. Presently, BTC is trading at $13,794 at the time of writing. Bitcoin is above the 80% range of the daily stochastic. The market is in a strong bullish momentum
Bitcoin (BTC) Indicator Reading
The price bars are well sustained above the resistance line of the ascending channel. This makes the upside momentum to be ongoing. The market is still in the overbought region. Although in a trending market, the overbought or oversold conditions may not hold.
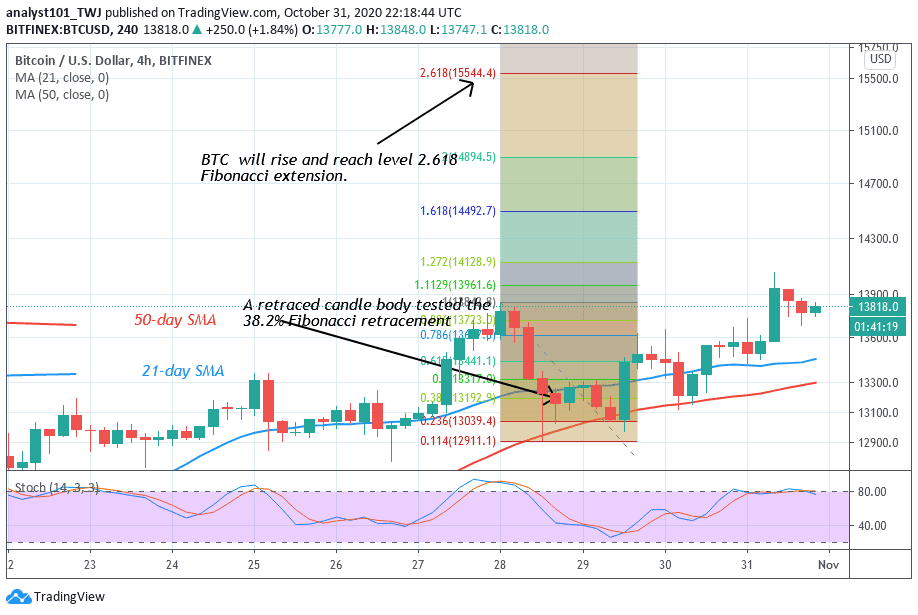
Meanwhile, the price action has remained the same for the past few hours. Bitcoin is likely to rise to break the $14,000 resistance. The Fibonacci tool analysis has indicated a further rise of the coin. On October 28 uptrend; the retraced candle body tested the 38.2% Fibonacci retracement level. This retracement indicates that the market will rise to a level of 2.618 Fibonacci extensions. In other words a high of $15,544.40.
Join Our Telegram channel to stay up to date on breaking news coverage
