Join Our Telegram channel to stay up to date on breaking news coverage
BCH Price Prediction – October 31
Bitcoin Cash shows an amazing intraday hike as it rises from today’s low of $259 to touch the daily high at $266.
BCH/USD Market
Key Levels:
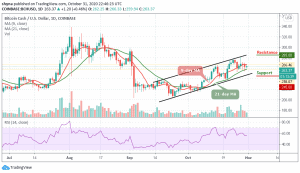
Resistance levels: $285, $295, $305
Support levels: $245, $235, $225

BCH/USD is currently trading within the 9-day and 21-day moving averages. The coin is hovering at $263.37 after touching the daily at $266.33. However, the coin is seen focusing on the bullish momentum after a sustainable break above the 9-day moving average. More so, the coin gains 0.46% within 24 hours as it is using $258 support as a jumping-off ground to develop the upside momentum, which is now gaining traction.
Where is BCH Price Going Next?
On the upside, if BCH/USD stays above the 9-day and 21-day moving averages, the market price may likely break-through another resistance at $270 and $280 respectively. Meanwhile, the technical indicator may show that the bulls are ready for action especially if the RSI (14) crosses above the 60-level. Any further bullish movement may pave the way to the resistance levels of $285, $295, and 305.
On the other hand, if the price falls below the 9-day moving average, the market may be compelled either to a range-bound or begin a downward movement. This could serve as a major blow for the market sentiments as traders may interpret it as a sign of underlying weakness. The next available support may come at $250, which could be followed by $245, $235, and $225 support levels.
Again Bitcoin, the Bitcoin Cash is facing the south as the sellers are gaining the market as the price is trading under the 9-day and 21-day moving averages falling towards the lower boundary of the channel while the RSI (14) moves below the 40-level.

However, the downtrend is seen as giving the sellers more power to increase their entries. More so, if the bears succeeded in breaking below the channel, BCH/BTC may likely fall to the support level of 0.1750 BTC and below. Meanwhile, a rebound could push the price above the moving averages and increase it to the resistance level of 0.0250 BTC and above.
Join Our Telegram channel to stay up to date on breaking news coverage