Join Our Telegram channel to stay up to date on breaking news coverage
Bitcoin (BTC) Price Prediction – October 19, 2020
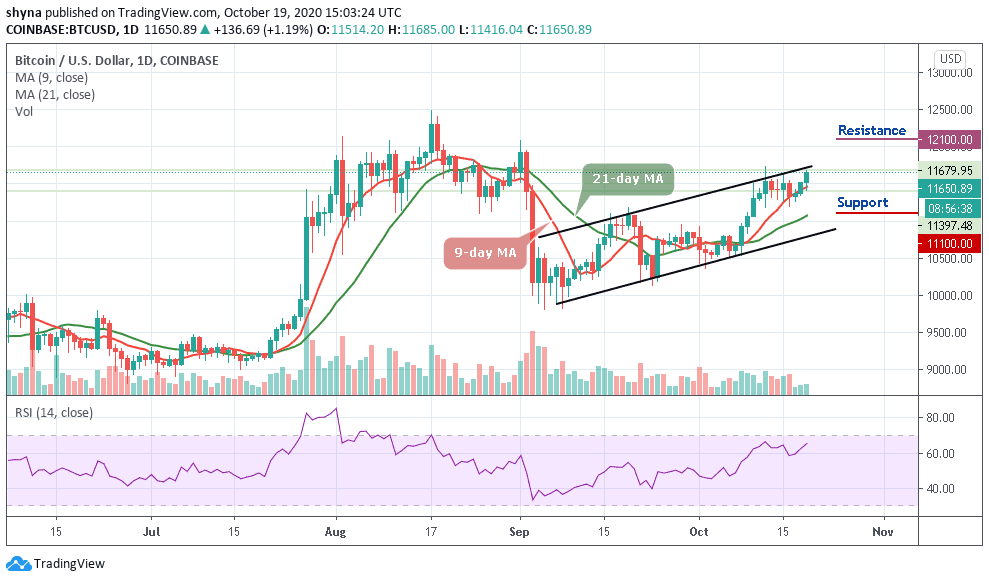
BTC/USD price rallied above $11,500 resistance to reach $11,800 high. The king coin reaches striking distance below the $12,000 overhead resistance. The coin intends to make brief consolidation before resuming the upside momentum
Resistance Levels: $10,000, $11,000, $12,000
Support Levels: $7,000, $6,000, $5,000
Since October 13, Buyers have been making concerted efforts to break the resistance at $11,500. On the 1-hour chart, the $11,500 resistance was tested on five occasions. The several retests contributed to weakening the resistance. This makes the breakout to be powerful. The recent rally was interrupted at the $11,800 high. The bulls could not break the recent resistance as the price was compelled to a sideways move below $11,800.
This is an advantage to the bulls as a strong bounce below the $11,800 will break the resistance and retest the $12,000 overhead resistance. The market will continue with the bullish move if buyers are successful above the $12,000 high. A retest at the $12,400 resistance is likely. However, if buyers fail to push the coin above the overhead resistance, Bitcoin will be compelled to a sideways trend. Alternatively, the coin may fall
Bitcoin (BTC) Indicator Analysis
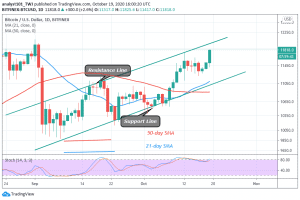
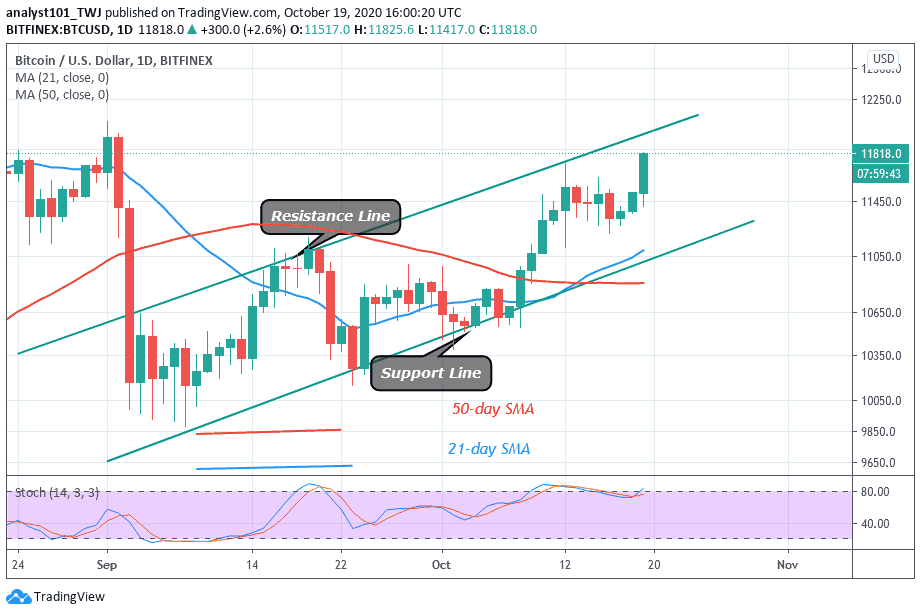
BTC price is approaching the resistance line of the ascending channel. A break above the resistance will catapult the coin to a further upward move. The Relative Strength Index and the daily stochastic have shown that BTC price has reached the overbought region of the market. This explains the fact that sellers will emerge at any point in time to push prices downward.

Meanwhile, Bitcoin’s price has rallied toward the $12,000 overhead resistance. According to the Fibonacci analysis, BTC price will retest the overhead resistance. On October 12 uptrend a retraced candle body tested the 78.6% Fibonacci retracement level. This retracement gives us the clue that the current uptrend will reach a high of 1.272 Fibonacci extensions. That is a high $12,148.50. The current uptrend will reach that level, and BTC will reverse and return to 78.6 % Fibonacci retracement level where it originated.
Join Our Telegram channel to stay up to date on breaking news coverage