Join Our Telegram channel to stay up to date on breaking news coverage
Bitcoin (BTC) Price Prediction – November 29, 2020
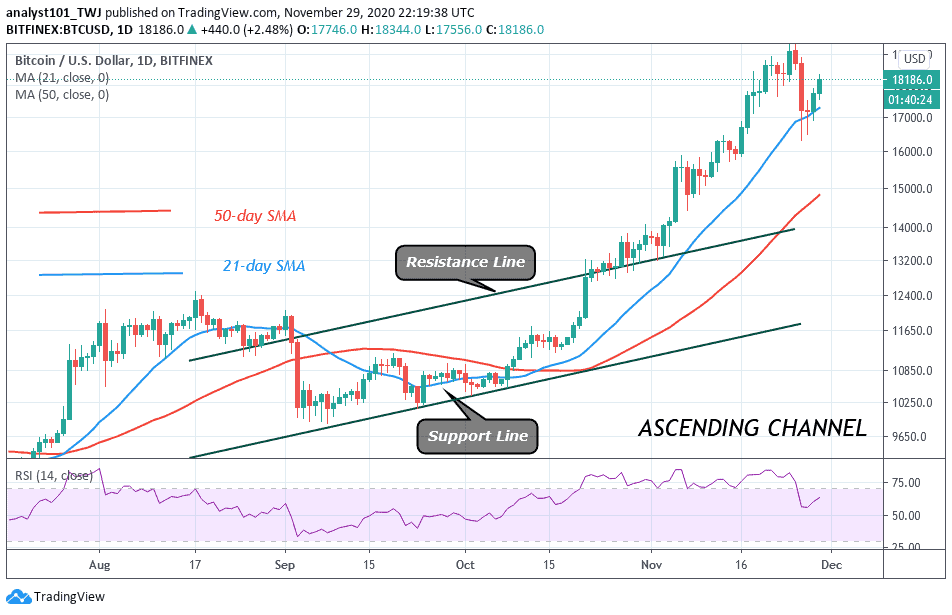
On November 26, after the breakdown, the bearish candlesticks were closed with long tails. The long tails indicate that the bulls have bought the dips as the support level holds. Today, BTC/USD is trading above the $18,000 price level. Bitcoin is moving up to retest the previous highs.
Resistance Levels: $13,000, $14,000, $15,000
Support Levels: $7,000, $6,000, $5,000

Bitcoin upward move above $18,000 is facing rejection. Today, a candlestick with a long wick pointing at $18.300 is facing resistance. It indicates that there is selling pressure at that price level. Similarly, on November 18, at that price level, buyers were repelled. However, after a pullback the resistance level was retested and broken. On the upside, if the bulls can push BTC above $18,300, a rally above $19,000 is likely. However, if buyers fail to resume the upside momentum, Bitcoin will be compelled to a sideways move. Perhaps a downward movement of the coin is likely.
Bitcoin (BTC) Indicator Reading
The 21-day SMA and the 50-day SMA are pointing northward indicating the uptrend.The 21-day SMA is acting as a support for the BTC price. A break below the SMAs means a downward movement of the coin.Meanwhile, BTC price is above 80% range of the daily stochastic. It indicates that the coin is trading in the overbought region of the market.

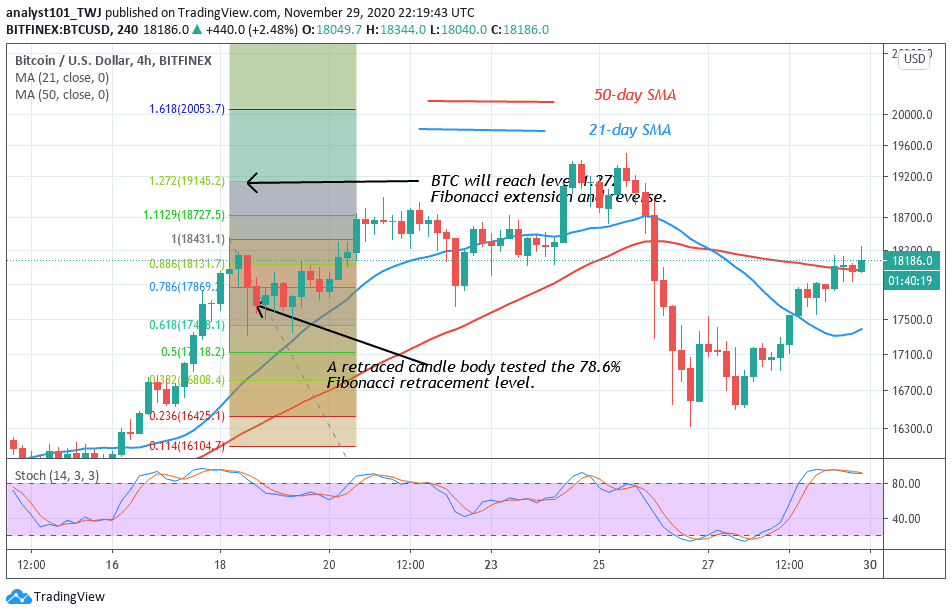
Nevertheless, buyers are attempting to push BTC on the upside. The Fibonacci tool indicates a possible move of the coin. On November 18 uptrend; the retraced candle body tested the 78.6% Fibonacci retracement level. This retracement indicates that the market will rise to level 1.272 Fibonacci extensions. In other words, Bitcoin will rise to $19,145 and reverse. BTC price will reverse and return to the 78.6% Fibonacci retracement level where it originated.
Join Our Telegram channel to stay up to date on breaking news coverage

