

Join Our Telegram channel to stay up to date on breaking news coverage
Bitcoin (BTC) Price Prediction – November 23, 2020
For the past week, Bitcoin has continued to trade below $18,800 resistance. There has been no significant price movement. BTC/USD now fluctuates between $17,700 and $18,800.
Resistance Levels: $13,000, $14,000, $15,000
Support Levels: $7,000, $6,000, $5,000

Since November 18, the bulls and bears have been contesting the price between $17,700 and $18,800. Buyers and the Sellers have not been able to break the range-bound levels. The current correction has lasted for six days. BTC price ought to have resumed the upside momentum or the uptrend. In previous price action, the uptrend will resume within three days of corrections. For the past six days, BTC price has been stalled in the current price range. The $18,800 resistance has impeded the recent bullish momentum. If buyers can push BTC above $18,800, BTC will rally above $19,200. Similarly, if the bulls fail to break the recent level, the bears may break the lower price range of $17,700. This will push the coin to the low at $16,450. Meanwhile, BTC is trading in the overbought region of the market.
Bitcoin (BTC) Indicator Reading
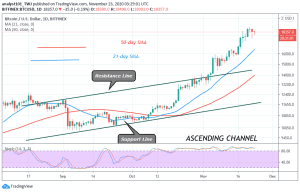
Since October 10, BTC price has remained above the 80% range of the daily stochastic. That is, the coin has been trading in the overbought region of the market. Minor corrections appear to occur for one to three days. Thereafter, the bullish momentum will resume. This has been the market scenario. The moving averages are pointing northward indicating the uptrend.

Meanwhile, the BTC price has been stalled below $18,800. The Fibonacci tool analysis has indicated a further upward movement of the coin if the upside momentum resumed. On November 18 uptrend; the retraced candle body tested the 78.6% Fibonacci retracement level. This retracement indicates that the market will rise to level 1.272 Fibonacci extensions $19,155.8 and reverse. However, the reversal will not be immediate.
Join Our Telegram channel to stay up to date on breaking news coverage
