Join Our Telegram channel to stay up to date on breaking news coverage
Bitcoin (BTC) Price Prediction – April 18, 2021
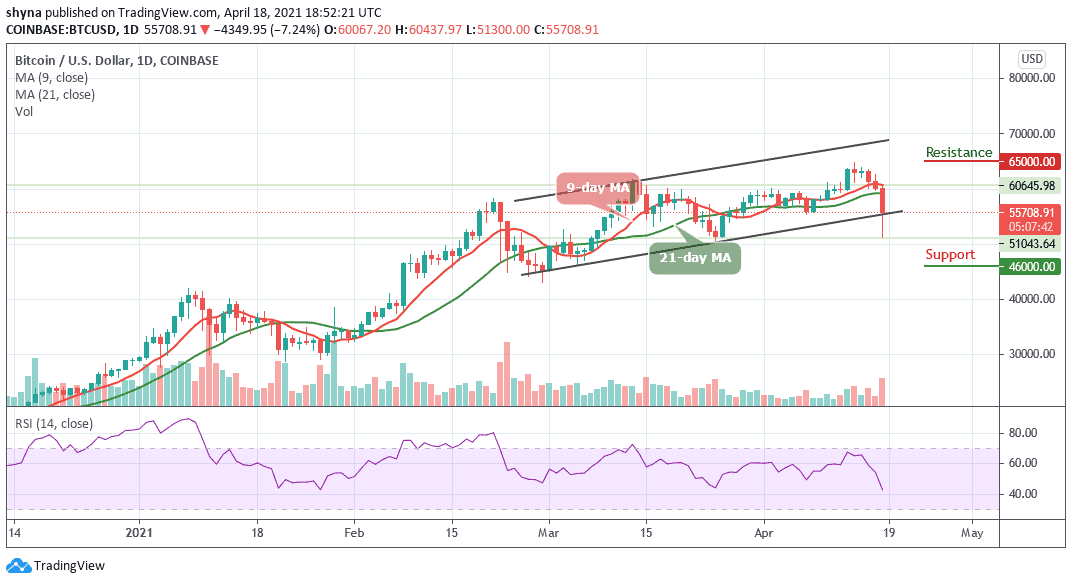
Today, BTC price slumped to $50,500 low after its rejection from the $65,000 high. Immediately, the bulls buy the dips, BTC/USD resumes a fresh uptrend. As usual, buyers are likely to face resistance at the $57,000 or $58,000 resistance levels. The $58,000 has been a crucial price level. The BTC price seems to have accelerated price movement either below or above it.
Resistance Levels: $65,000, $70,000, $75,000
Support Levels: $50,000, $45,000, $40,000
Following its decline to the $50,000 support, the bulls buy the dips to prevent the king coin from further decline. The upward correction is presently facing rejection at the $56,000 high. BTC price has resumed a downward correction as price fluctuates between $50,500 and $56,000. The king coin will encounter further downside if price faces rejection at $56,000 and the bears break the $50,500 support. Bitcoin price will fall to $43,006 support.
This will indicate that buyers are showing signs of weakness at the lower price range. On the other hand, if Bitcoin has strong bullish momentum, a rebound will clear the resistances at $56,000 and $57,000. For instance, on March 28, Bitcoin rebounded above $48,000 support as price rallied and retested the $58,000 high. After a pullback, BTC price retested $58,000 resistance and broke it. This propels Bitcoin to resume upside momentum.
Bitcoin (BTC) Indicator Reading
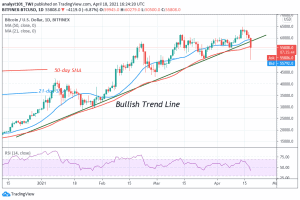
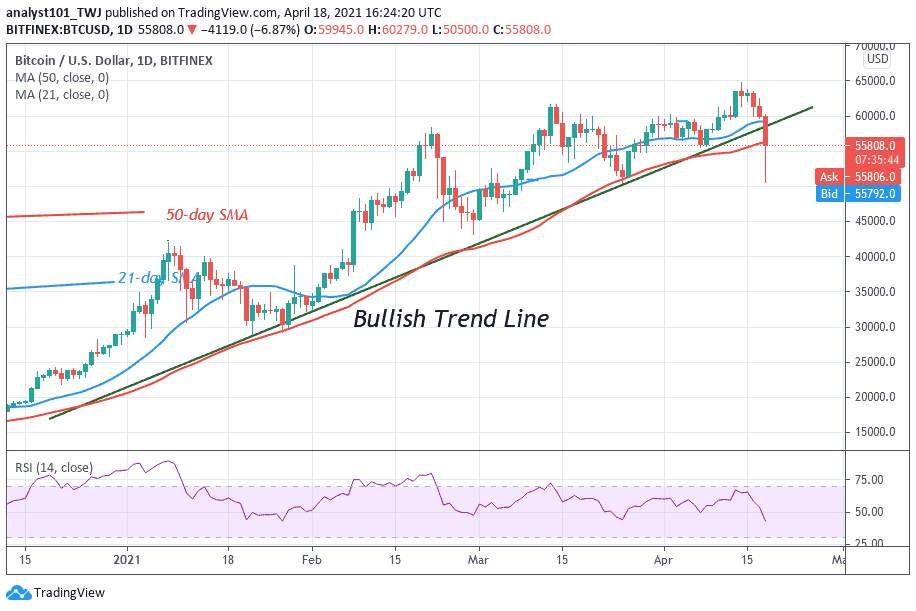
Bitcoin price retraces and breaks below the bullish trend line. When price breaks and closes below the trend line, it is assumed that the uptrend has been terminated. On the other hand, if price breaks and closes above a trend line, it will signal the resumption of an upward move. Presently, Bitcoin is above the 30% range of the daily stochastic. It indicates that the market is in the bullish momentum. The daily Relative Strength Index period has fallen to level 43 of Bitcoin. It indicates that the coin is in the downtrend zone and capable of falling.
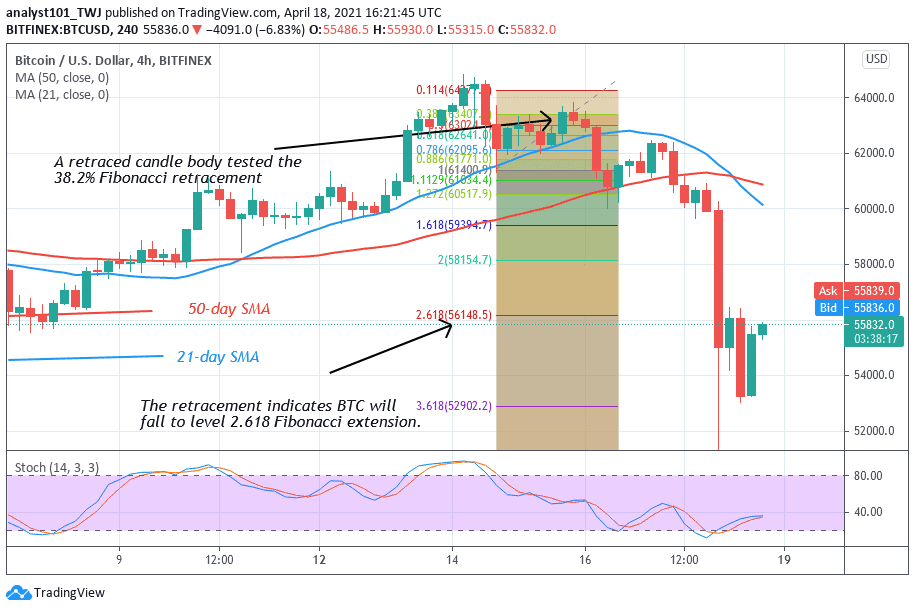
Bitcoin is currently in a downtrend move but the king coin is correcting upward. The upward move is stalled as price fluctuates between $50,500 and $56,000.Meanwhile, on April 14 downtrend; a retraced candle body tested the 38.2% Fibonacci retracement level. The retracement implies that Bitcoin will fall to level 2.618 Fibonacci extension or the low of $56,148. Nonetheless, from the price action, Bitcoin price fell to $50,500 low and corrected upward.
Join Our Telegram channel to stay up to date on breaking news coverage