Join Our Telegram channel to stay up to date on breaking news coverage
Bitcoin (BTC) Price Prediction – August 29, 2020
Since August 27, the $11,200 support has been holding. The bears have tested the support thrice as bulls buy the dips to push prices upward. There is a balance as BTC/USD fluctuates between $11,200 and $11,600.
Resistance Levels: $10,000, $11, 000, $12,000
Support Levels: $7,000, $6,000, $5,000

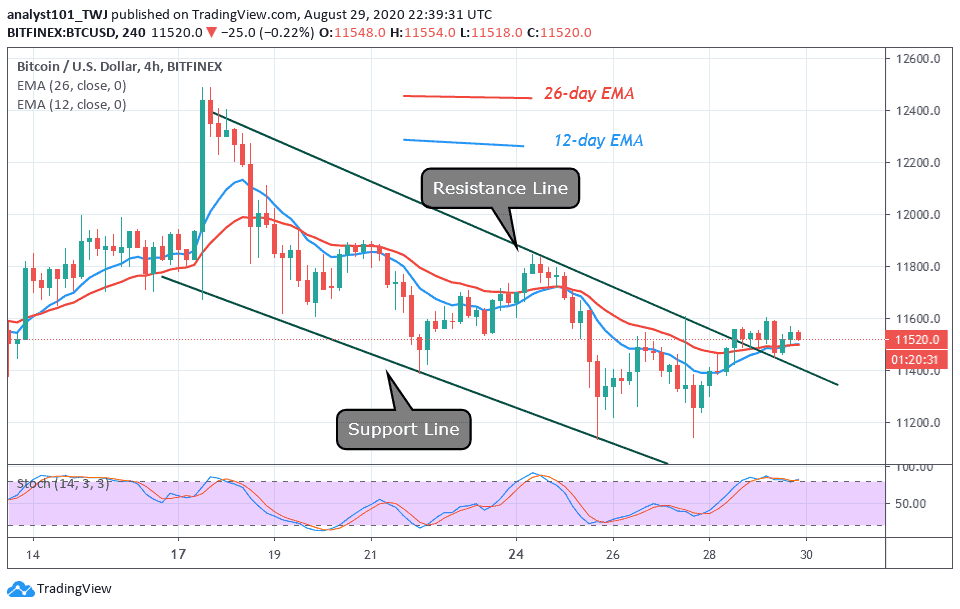
The king coin is now trading in a range between $11,200 and $11,600. The bears have not been able to break the support level because BTC rebounds at the crucial support level. On the other hand, the bulls have not been able to break the $11,600 resistance after two attempts. On the upside, if buyers push BTC price above the 12 –day EMA, the price momentum will be accelerated to break the $11,600 and $11,800 resistance.
The momentum will extend to break the $12,000 overhead resistance. The bullish scenario for Bitcoin reaches a high of $15,000 if the breakout above $12,000 occurs. However, Bitcoin will have bearish consequences if the bulls fail to break the $12,000 overhead resistance. The market will resume a downward move. For instance, the price will drop to $11200, and a further downward move to $11,000. The downward momentum will extend to $10,400.
Bitcoin (BTC) Indicator Analysis
Bitcoin price is neither below nor above the 12-day EMA and 26-day EMA. BTC price is stable above the $11,500. The Relative Strength Index period 14 is at level 51 which indicates that the market is said to be at equilibrium between supply and demand.

Nevertheless, Bitcoin bulls have broken above the resistance line. The price has also closed above it. The market will resume an upward move if the initial resistance levels are broken. The price is also above the EMAs which indicates an upward movement of the coin.
Join Our Telegram channel to stay up to date on breaking news coverage

