Join Our Telegram channel to stay up to date on breaking news coverage
ETH Price Prediction – August 29
ETH/USD is seen climbing higher and settling above the main $400 barrier.
ETH/USD Market
Key Levels:
Resistance levels: $450, $455, $460
Support levels: $335, $330, $325
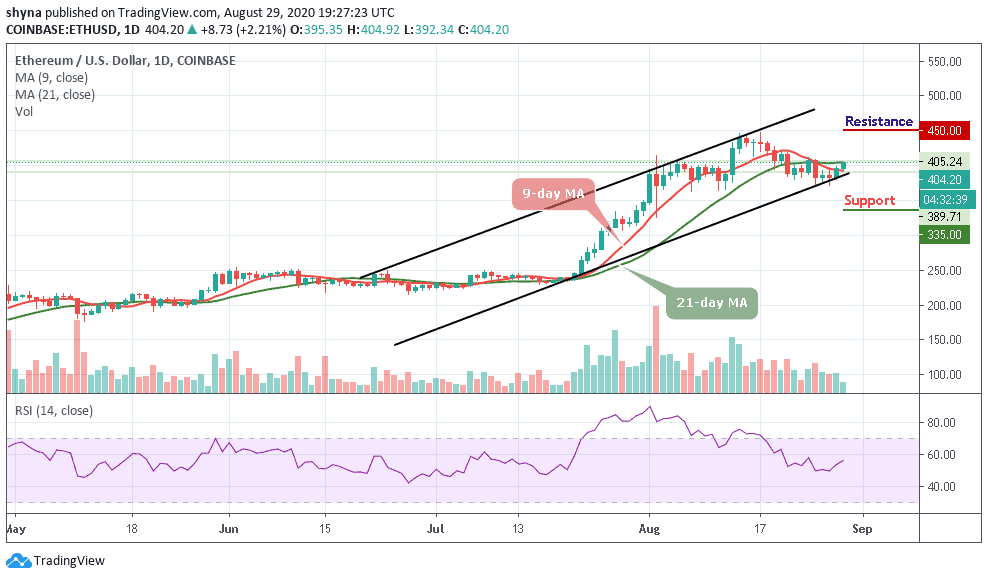
ETH/USD has once again touched the $400 mark as the number two crypto faces the path of development once again but this can only be confirmed if the market price remains above $400. However, the Ethereum price is hovering within the 9-day and 21-day moving averages at $404.20 with 2.21% gains in the last 24 hours. ETH/USD may again drop below this level if the bulls fail to push it above the 21-day MA.
What to Expect from Ethereum (ETH)
According to the daily chart, traders can observe that since the beginning of this month, ETH/USD has not been able to display the strong bullish momentum. Nevertheless, the good thing is that the coin is not decreasing drastically. So, the Ethereum price needs to stay above $400 consistently for the next few days to regain the proper bullish momentum as the technical indicator RSI (14) moves above 55-level.
However, the Ethereum price only needs to conquer a few crucial resistance levels of $410 and $420 to stay comfortably in the $430 and $440 territory. Now, if the coin closely manages these levels well, it may reach the potential resistance levels at $450, $455, and $460 respectively. On the downside, if the bears wish to maintain their drive, ETH/USD may likely drop below the $390 and then further bearish movement could to the critical supports at $335, $330, and $325.
When compared with Bitcoin, Ethereum is still trading near the lower boundary of the channel above the 9-day and 21-day moving averages. The price is changing hands at 3507 SAT as the technical indicator RSI (14) moves around 58.45-level.
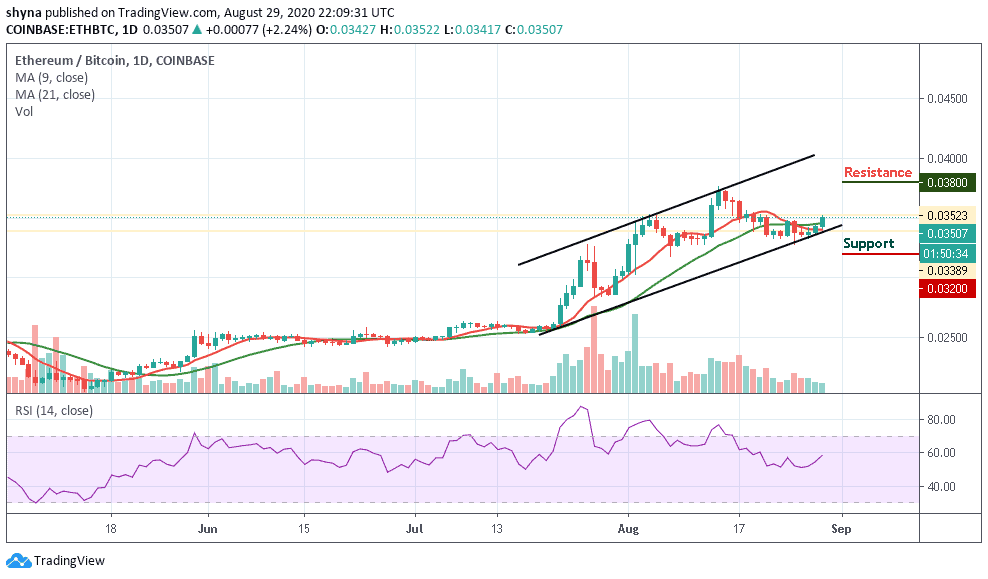
However, the daily chart reveals that the buyers are having the day. Therefore, the resistance levels to be reached are 3800 SAT and 4000 SAT. Conversely, a lower sustainable move may likely cancel the bullish pattern and could attract new sellers to the market with the next focus on 3200 SAT and 2000 SAT support levels.
Join Our Telegram channel to stay up to date on breaking news coverage