Join Our Telegram channel to stay up to date on breaking news coverage
BNB Price Analysis – August 25
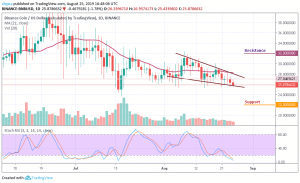
Binance Coin (BNB) currently moves at $25.87 and this heavy price fall delays its quick recovery.
BNB/USD Market
Key Levels:
Resistance levels: $32, $34, $36
Support levels: $22, $20, $18
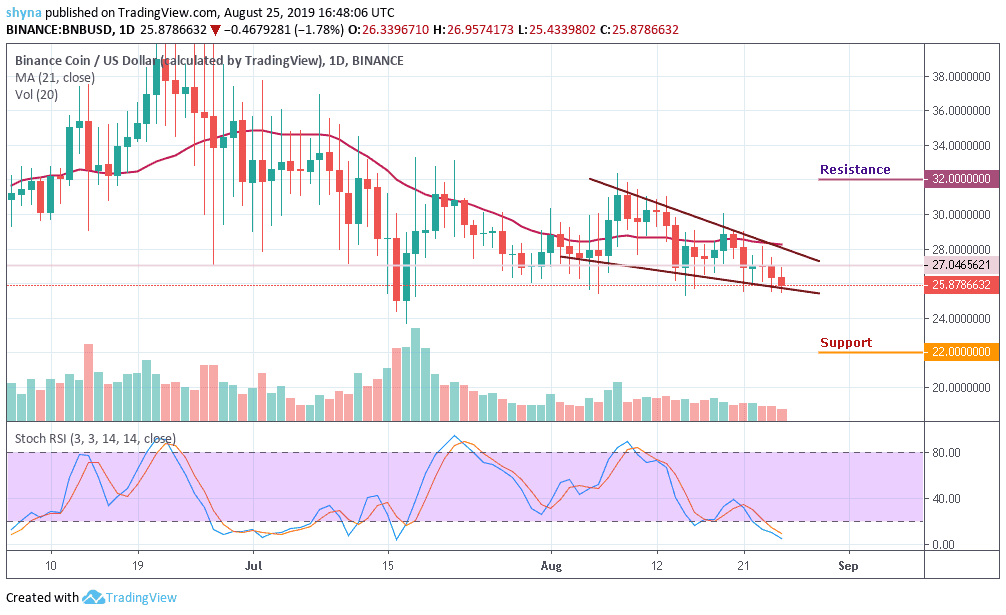
The price of Binance Coin (BNB) is currently disappointing for many traders. The coin started the downtrend a week ago and still has not recovered. The price chart is immersed in red color. In addition, there does not seem to be any sign of improvement with the intraday price movement which encourages traders to rethink their investment option.
Yesterday, the BNB coin started at $27.0. The price took a steep walk from $27.0 to $27.5 by 3.24%. The coin closed at $26.3 with an intraday loss of 2.20%. Today, the coin is again falling. Today BNB opened at $26.4 and is now dealing at $25.8. The loss marked on the chart is of 1.69%. The significant resistance levels are $32, $34 and $36 but if the price experiences a break below the $24 level, it could cause a bearish wave and beneath this, further supports could be found at $22, $20 and $18 levels.
The Stochastic RSI for BNB is already in the oversold zone; possible buying pressure is likely if it turns upward.
BNB/BTC Market
Comparing with Bitcoin, the price is moving within the ascending channel and in as much as the price actions keep respecting the ascending channel formation, Binance Coin will remain perpetually under the control of bull radar. Meanwhile, we need more strong and consistent resistance to keep the bull-run for the BNB market.
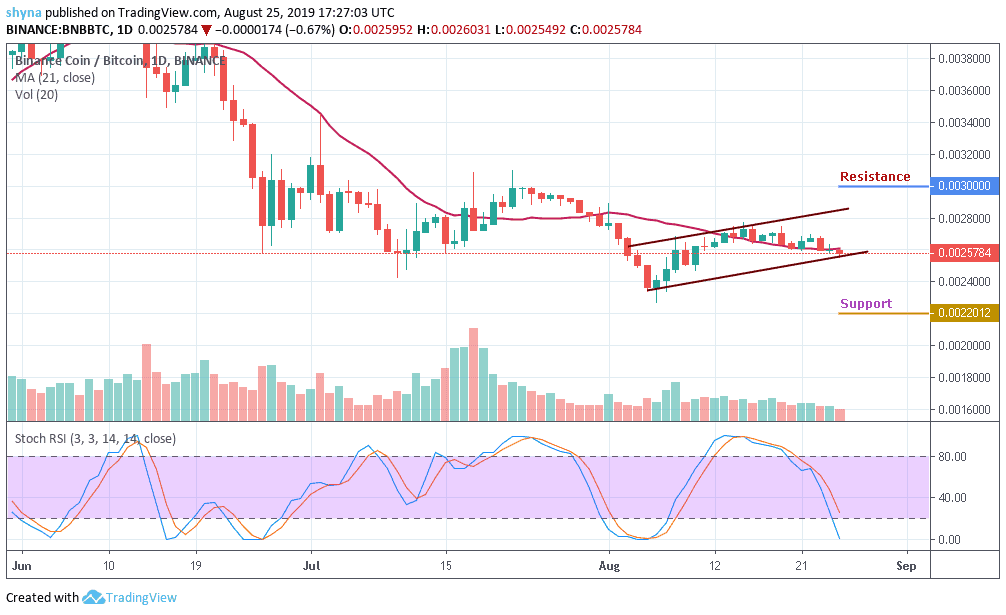
Meanwhile, with the current movement, if the price break down the channel and move below the 21-day moving average, it may likely reach the potential support levels at 0.0022 BTC and below. In other words, if the market can break out of the channel, the price of BNB is likely to hit $0.0030 BTC, $0.0032 BTC, and $0.0036 BTC resistances. The stochastic RSI faces downward indicating more of bearish signals.
Please note: insidebitcoins.com is not a financial advisor. Do your own research before investing your funds in any financial asset or presented product or event. We are not responsible for your investing results.
Join Our Telegram channel to stay up to date on breaking news coverage