Join Our Telegram channel to stay up to date on breaking news coverage
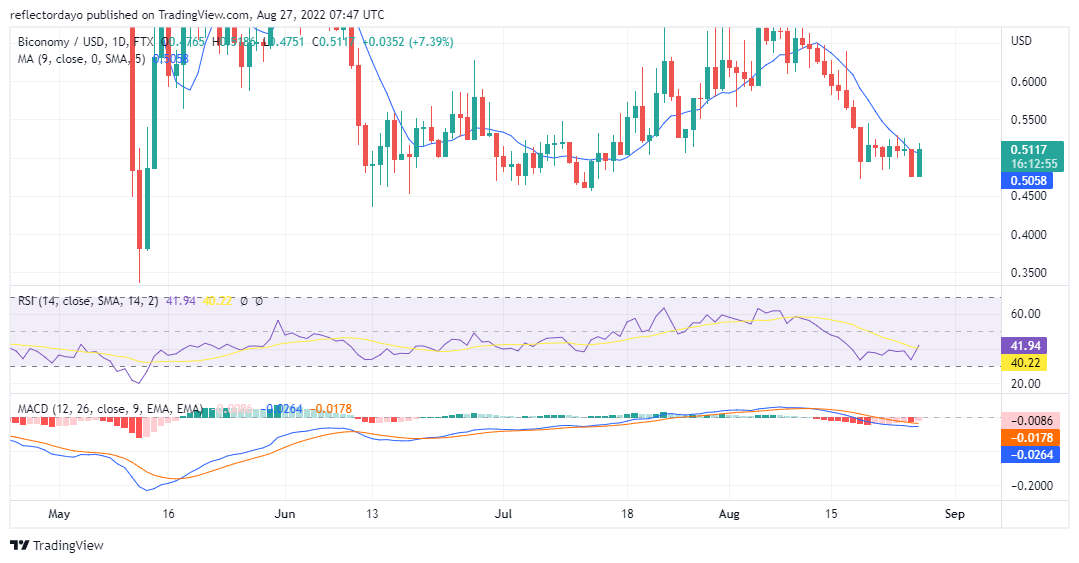
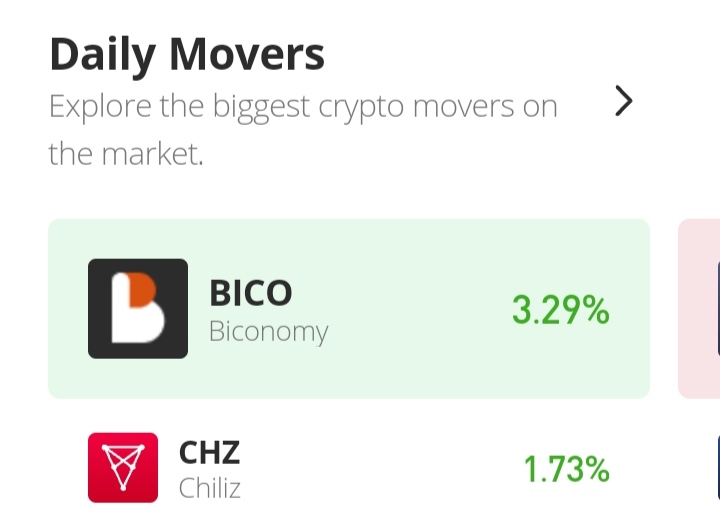
Biconomy (BICO/USD) may be at the end of the downtrend after a while of price consolidation. The downtrend started on the 11th to the 19th, but then, it could not trend down any further because the buyers became aggressive enough to prevent the falling price for that day. On the 20th, buyers had the market of the day. The price consolidation continues for six days. Then following yesterday’s very bearish market, the 27th-day trading session starts in favour of the buyers. And the bullish price action may likely break the 9-day moving average and the $0.5043 Resistance level.
Biconomy Price Statistic:
- BICO/USD price now: $0.5047
- BICO/USD market cap: $ 86,172,063
- BICO/USD circulating supply: 172,200,410.99
- BICO/USD total supply: 1,000,000,000
- BICO/USD coin market ranking: #267
Key Levels
- Resistance: $0.5112. $0.5413, $0.5674
- Support: $0.4746, $0.4500, $0.400
Your capital is at risk
Biconomy Price Analysis: The Indicators Point of View
In the Relative Strength Index, the RSI indicator line has just crossed the signal line with a tiny difference of 0.21%. And the RSI line shows a strong prospect of continuation on the high side. The Crossing of this signal line is significant as it means a change in the direction of the market. Moving Average Convergence and Divergence also support the indications of the RSI. According to the behaviour of today’s histogram, the pink histogram of -0.0086 signifies a bullish recovery sentiment. Here also the two lines are about to cross each other. Once this happens, it will also confirm that the trend is reversing to the upside. The swing momentum is so strong that while I am writing this analysis, the price action crosses the 9-day moving average to confirm that the trend is changing.
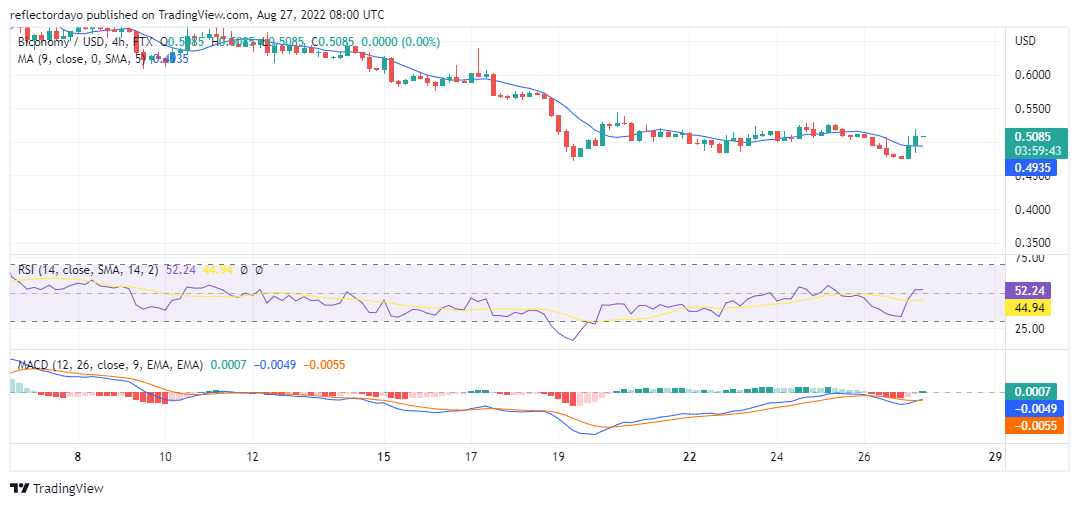
Biconomy Price Analysis: BICO/USD 4-Hour Chart Outlook
The first two sessions of today show very strong buying pressure. The bears came up in the second session but they were not strong enough to take their ground in the market. The two indicators in this session already have it that the trend has changed to a bullish trend. The RSI line has already crossed into a bullish zone with a measurement of 52%. However, towards the later end of the second session, selling pressure appears to be increasing.
Related
- How to Buy Tamadoge
- Visit Tamadoge Website
Join Our Telegram channel to stay up to date on breaking news coverage