
Join Our Telegram channel to stay up to date on breaking news coverage
Finding the best crypto to buy right now is a never-ending task, with dozens of tokens launched on CEX and DEX platforms daily.
In the latest crypto market update, the total market capitalization is $1.64 trillion, reflecting a modest increase of 0.80% over the past 24 hours. However, the total 24-hour trading volume for cryptocurrencies has reached $269.61 billion, marking an 11.39% upturn within the same timeframe.
Best Crypto to Buy Now
Bitcoin is currently valued at $43,483, showcasing a -1.07% dip over the last 24 hours. Despite this slight decline, Bitcoin dominance has experienced a -0.98% decrease, currently at 51.99%.
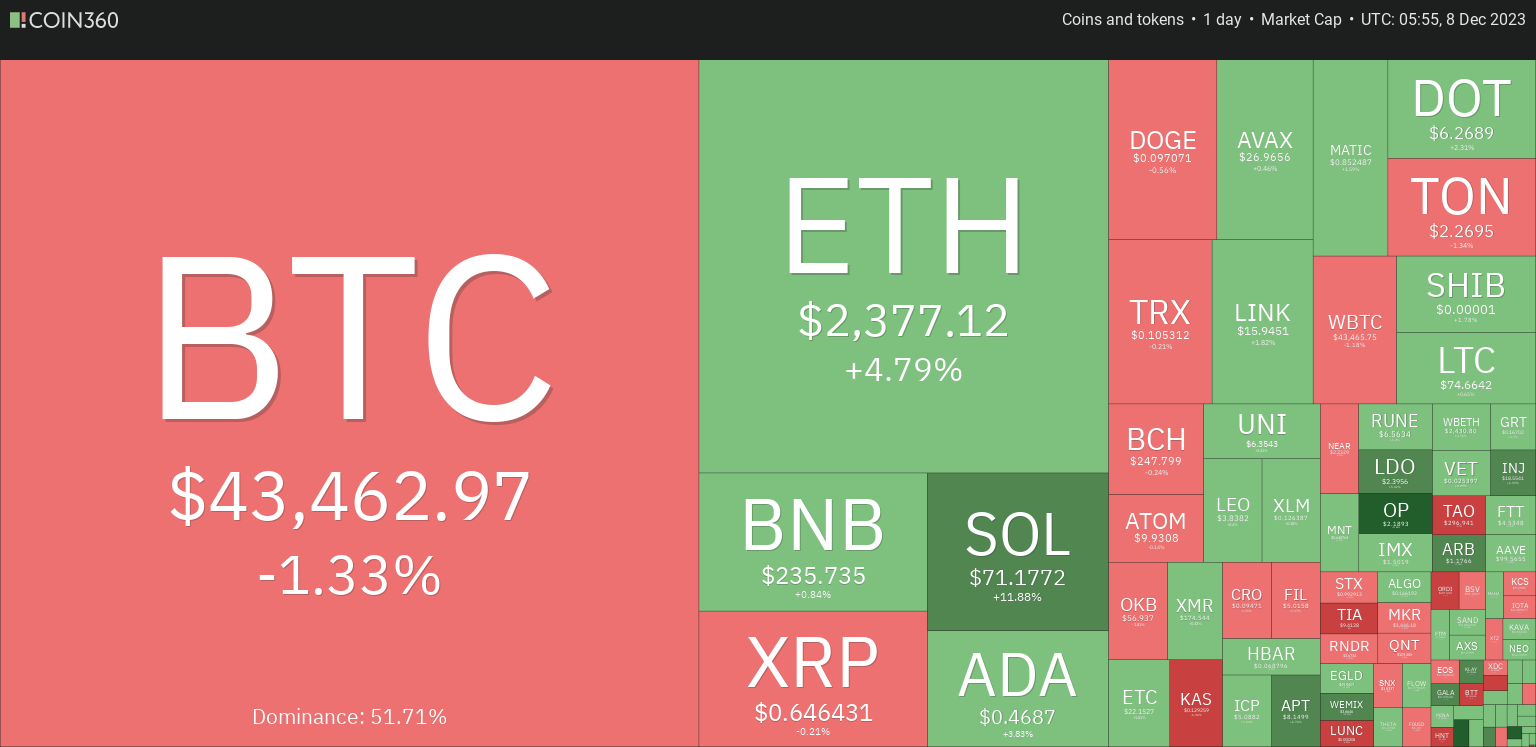
This market snapshot suggests a relatively stable yet dynamic environment, with incremental market cap and trading volume changes. Bitcoin’s minor dip in value is mirrored by a fractional reduction in its dominance, indicating a distributed market sentiment. As the market evolves, these metrics offer valuable insights into the ongoing trends and fluctuations within the cryptocurrency landscape.
1. Gas (GAS)
Gas, a cryptocurrency within the NEO Network sector, has displayed noteworthy trends in its recent performance. On January 16, 2018, Gas reached its pinnacle at $106.25, marking an all-time high. Conversely, its lowest point was recorded on March 13, 2020, when it traded at an all-time low of $0.581059.
Since the last cycle low, Gas peaked at $29.06, constituting the cycle high. The sentiment for Gas price prediction is neutral, complemented by a Fear & Greed Index reading of 72 (Greed). GAS currently stands at 65.31 million out of a maximum supply of 100 million.
The yearly supply inflation rate is 544.79%, creating 55.18 million GAS in the past year. Within the NEO Network sector, Gas holds the second rank by market cap. Noteworthy highlights include a 268% price increase over the last year, outperforming 89% of the top 100 crypto assets in the same period.
It has also surpassed both Bitcoin and Ethereum in performance. The coin trades above its 200-day simple moving average, indicating a positive trend.
2. Bitcoin Minetrix (BTCMTX)
Bitcoin Minetrix has introduced a distinctive system where users stake BTCMTX tokens to access cloud mining credits. This aims to decentralize control and provide a secure mining environment for token holders. The current number of staked BTCMTX tokens exceeds 400,000, indicating substantial interest in the project.
#BitcoinMinetrix is paving the way for a fresh approach to cloud mining, integrating stakeholding and cloud mining.
By prioritizing transparency, independence, and safety, #BitcoinMinetrix pioneers tokenized cloud mining, providing a reliable path for $BTC mining. 🌐⚒️ pic.twitter.com/Itz9l8vO89
— Bitcoinminetrix (@bitcoinminetrix) December 6, 2023
With a pledged annual percentage yield (APY) of 103,225%, a high figure, the project has attracted participants to its staking pool. The ongoing BTCMTX presale further underscores the project’s apparent success, having raised over $5,022,866.12 by selling tokens at $0.0121 each. Notably, the next price increase is scheduled in four days.
During the presale phase, 70% of the total token supply (2.8 billion out of 4 billion BTCMTX) is available for purchase using either ETH or USDT. This phase has played a crucial role in generating interest among potential investors.
Bitcoin Minetrix‘s innovative staking system and commitment to decentralization and security have captured significant attention in the cryptocurrency landscape. The enticing APY and the ongoing presale, offering a substantial portion of the token supply, contribute to the project’s visibility and appeal to investors.
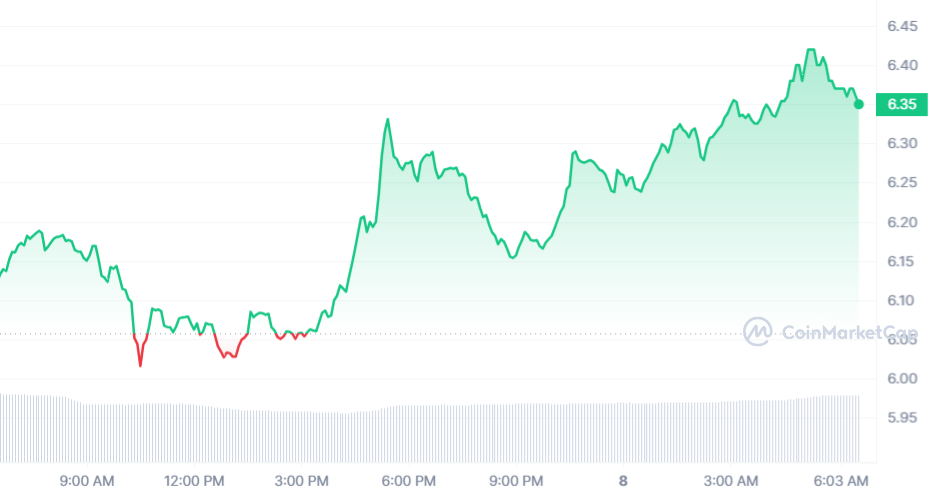
3. FTX Token (FTT)
FTX Token has exhibited a remarkable performance over the last year, boasting an impressive 221% increase. This growth outpaces 88% of the top 100 crypto assets within the same timeframe.
FTT achieved its pinnacle on September 9, 2021, hitting an all-time high of $84.09. In contrast, its lowest recorded price occurred on September 7, 2019, at an all-time low of $0.633373. Since then, the token’s price has fluctuated, with the lowest point post-ATH at $0.773385 and the highest at $5.46.
The latest available data shows that sentiment surrounding FTX Token leans towards optimism, in line with a bullish price prediction. This positivity is reinforced by the Fear & Greed Index, currently registering at 72 (Greed).
Meanwhile, FTX Token has outperformed both Bitcoin and Ethereum. The token trades above its 200-day simple moving average, suggesting a sustained positive trend. Over the past 30 days, FTX Token has experienced 18 positive trading sessions, constituting 60% of the observed period. This consistent upward momentum contributes to the perception of high liquidity, supported by its market cap.
The circulating supply of FTX Token stands at 328.90 million out of a maximum supply of 352.17 million. FTX Token holds the 6th position in the Exchange Tokens sector based on market capitalization.
FTX Token’s recent performance, comparative advantages over major cryptocurrencies, and positive technical indicators suggest a favorable outlook. However, as with any investment, potential investors should conduct thorough research and consider the inherent risks associated with the cryptocurrency market.
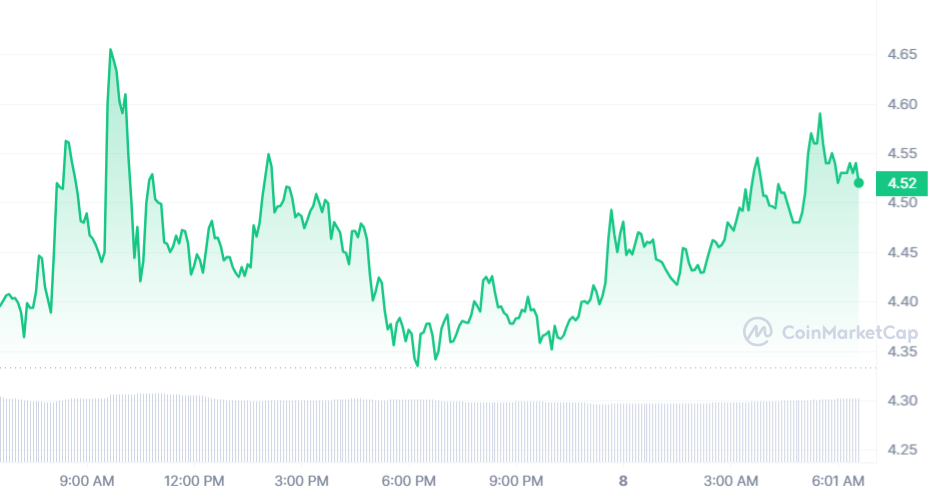
4. Uniswap (UNI)
Uniswap, a decentralized finance (DeFi) protocol, has seen a modest 6% price increase over the past year. Presently, the circulating supply of UNI is 588.19 million out of a maximum supply of 1 billion UNI. The yearly supply inflation rate is negative at -22.83%, reflecting a reduction of 174.02 million UNI over the past year.
In the DeFi Coins sector, Uniswap holds the fourth position by market cap and secures the second spot in the Exchange Tokens sector. Additionally, it ranks 1st in the Yield Farming sector and 7th in the Ethereum (ERC20) Tokens sector. The project demonstrates stability, consistently trading above its 200-day simple moving average.
DeFi is global — and so is Uniswap.
The Uniswap mobile app now supports seven languages and 18+ currencies.
Swap with confidence anytime, anywhere. 🦄🌍https://t.co/fHH6uqzaWX
— Uniswap Labs 🦄 (@Uniswap) December 5, 2023
Over the last 30 days, Uniswap has experienced 15 positive trading days, constituting 50% of the period, suggesting a balanced market performance. UNI’s liquidity is considered high based on its market capitalization.
The project’s inflationary trend is noteworthy, featuring a negative yearly rate of -22.83%, aligning with its goal of maintaining a controlled token supply. The current sentiment around Uniswap is optimistic, as price predictions indicate. However, the Fear & Greed Index stands at 72, pointing to a state of greed in the market.
5. Render (RNDR)
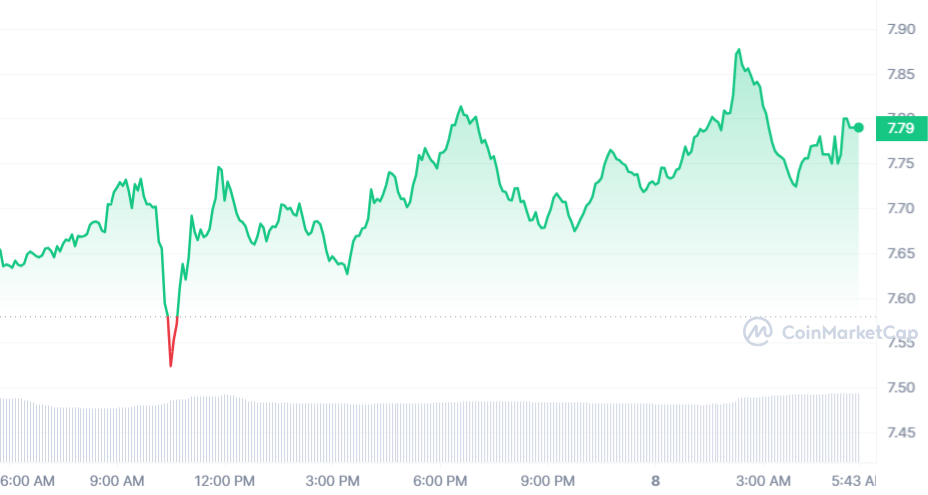
Over the past 7 days, Render (RNDR) has seen a 3.26% increase in price, signaling a recent adjustment in market conditions. RNDR hit its zenith on November 21, 2021, reaching an all-time high of $8.77. Nonetheless, it recorded its lowest value on September 22, 2020, trading at an all-time low of $0.000115.
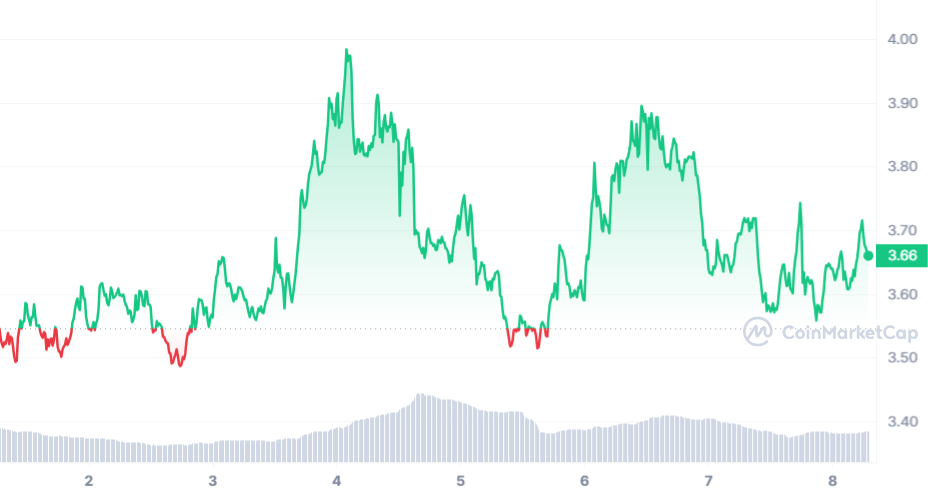
Following the peak, RNDR experienced a cycle low of $0.277999, followed by a subsequent cycle high of $4.01. Despite recent price shifts, the current sentiment regarding RNDR’s price prediction leans bullish. This optimism is corroborated by a Fear & Greed Index of 72 (Greed).
[1/7] Q3 2023 has been pivotal for the #RenderNetwork!
Here's the TLDR breakdown of @rendernetwork's key Q3 & October 2023 metrics from this week's BTN🧵https://t.co/YL2wYJGM1Q
— The Render Network (@rendernetwork) December 1, 2023
RNDR boasts 369.61 million RNDR tokens out of a maximum supply of 536.87 million RNDR, with a yearly inflation rate of 45.63%. This resulted in the creation of 115.82 million tokens in the past year, positioning it as a contender for the best crypto to buy now.
Within the Ethereum (ERC20) Tokens sector, Render Token holds the 16th position. The AI Crypto sector claims the 4th spot based on market capitalization. These metrics offer insights into RNDR’s position within its respective markets.
Read More
- Best Crypto to Buy Now
Best Wallet - Diversify Your Crypto Portfolio

- Easy to Use, Feature-Driven Crypto Wallet
- Get Early Access to Upcoming Token ICOs
- Multi-Chain, Multi-Wallet, Non-Custodial
- Now On App Store, Google Play
- Stake To Earn Native Token $BEST
- 250,000+ Monthly Active Users
Join Our Telegram channel to stay up to date on breaking news coverage