
Join Our Telegram channel to stay up to date on breaking news coverage
BCOUSD Price Analysis – June 02
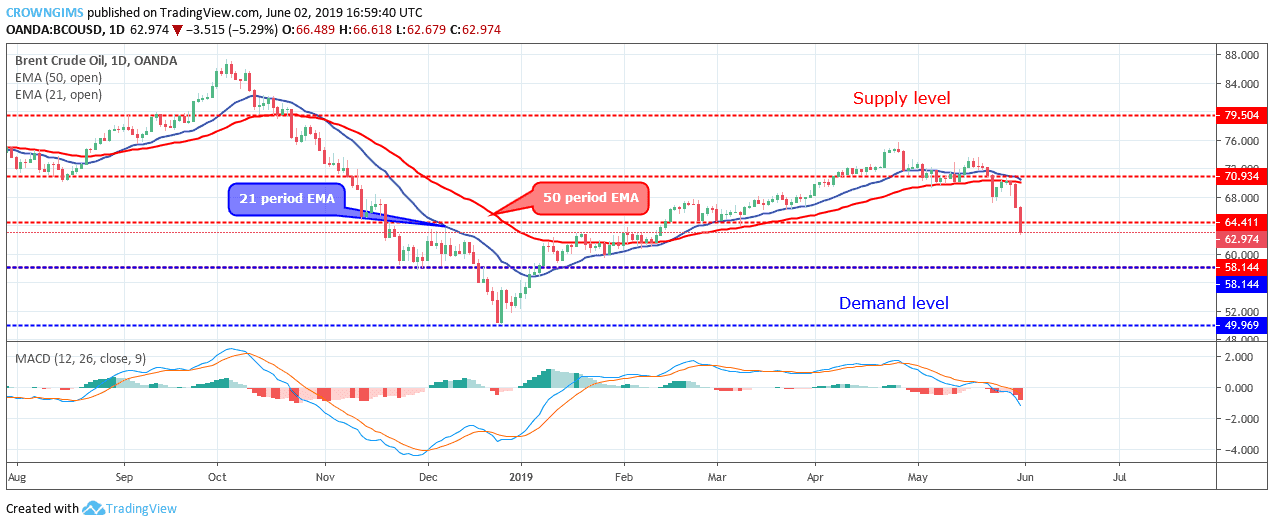
The Bears are fully in control of the Brent Crude Oil market. There is a possibility that the bearish movement may continue as the daily candle closed below the $64 level and the price may reach $58 price level.
BCO/USD Market
Key levels:
Supply levels: $64, $70, $79
Demand levels: $58, $49, $41
BCOUSD Long-term trend: Bearish
Brent Crude Oil is bearish on the long-term outlook. After consolidation at $70 level, the Bears dominated the market two weeks ago; that is why we have a strong bearish candle that penetrated the $70 price level. Last week, the Bears increased their momentum with the formation of another big weekly bearish candle that broke down the $64 price level and the price decreased further towards $58 price level. The energy is currently targeting the $58 level.

Brent crude Oil price has crossed the two EMAs downside, and the commodity is trading below the 21 periods EMA and the 50 periods EMA. The Moving Average Convergence Divergence period 12 with its histogram faintly trying to cross below the zero levels and the signal lines making attempts to cross each other downside; this connotes bearish movement. There is a possibility that the bearish movement may continue and the price may reach $58 price level.
BCOUSD medium-term Trend: Bearish
On the daily chart, Brent Crude Oil is on the bearish movement. Brent Crude Oil broke down the former demand level of $70 on May 23. The price experienced a pullback on May 24 and May 27 towards the broken level of $70. The bearish trend continued on May 30 and bearish candles were formed that broke down former demand level of $64 and the daily candle closed below the $64 level. This indicates that the Bears are fully in control of the Brent Crude Oil market and the bearish movement may continue.

The Moving Average Convergence Divergence with its histogram is below zero levels and the signal lines bending down to indicate sell signal.
Please note: insidebitcoins.com is not a financial advisor. Do your own research before investing your funds in any financial asset or presented product or event. We are not responsible for your investing results.
Join Our Telegram channel to stay up to date on breaking news coverage