Join Our Telegram channel to stay up to date on breaking news coverage
BCH Price Prediction – March 23
Bitcoin Cash buyers defend $500 support, which results in a shallow recovery above $530.
BCH/USD Market
Key Levels:
Resistance levels: $600, $650, $700
Support levels: $450, $400, $350
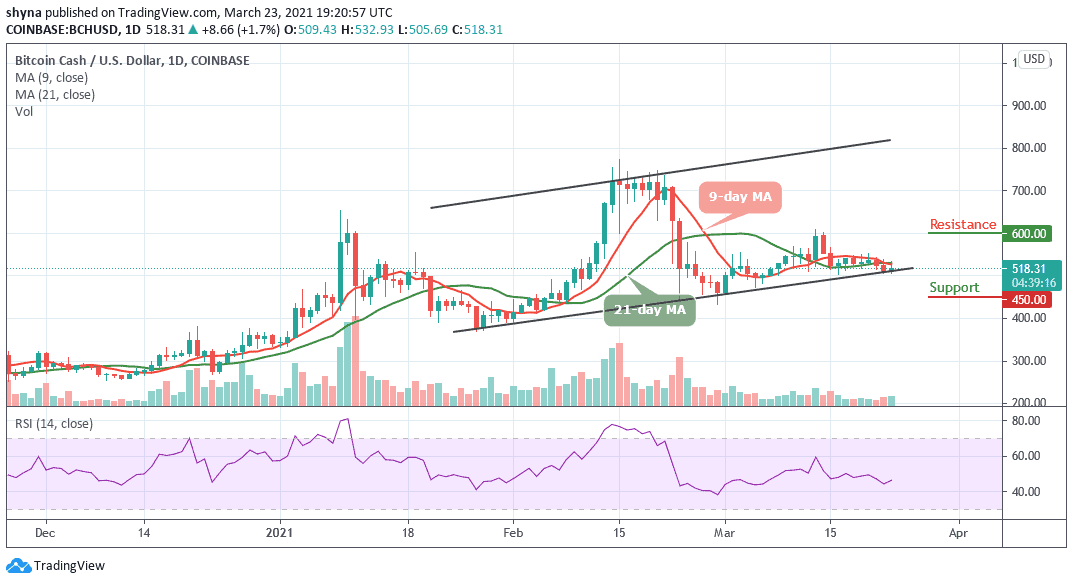
Since BCH/USD couldn’t break above the 9-day and 21-day moving averages, the price has had a bearish inclination and became an uphill task to sustain the gains above the potential $530 due to the renewed bearish momentum emanating from the rejection around $532. Bitcoin Cash (BCH) price is currently trading with a 1.7% gain, and the value remains below the moving averages.
Where is BCH Price Going Next?
Moreover, the Bitcoin cash is hovering at $518.31 but yet to break below the lower boundary of the channel. On the upside, a sustained move above $550 will ease the initial downside pressure and create momentum for the bulls with the focus to move the market to the next resistance levels of $600, $650, and $700 respectively. At the moment, the technical indicator remains within the bearish side, which indicates that the downward momentum may likely continue.
More so, the daily breakdown reveals that BCH/USD dropped to $505.69 at the opening of the market today after which it corrected itself to where it is currently trading. However, if the current support gets weaker, a price breakdown may occur as the bears could find new lows at $450, $400, and $350 support levels.
Against Bitcoin, the recent sideways movement in the market is due to the price stability in BCH trading. Another thing to note here is that the market is preparing to change the trend and a short-term bearish breakout is most likely to play out because the technical indicator RSI (14) moves below the 40-level and this could find the nearest support levels at 0.008 BTC and below.
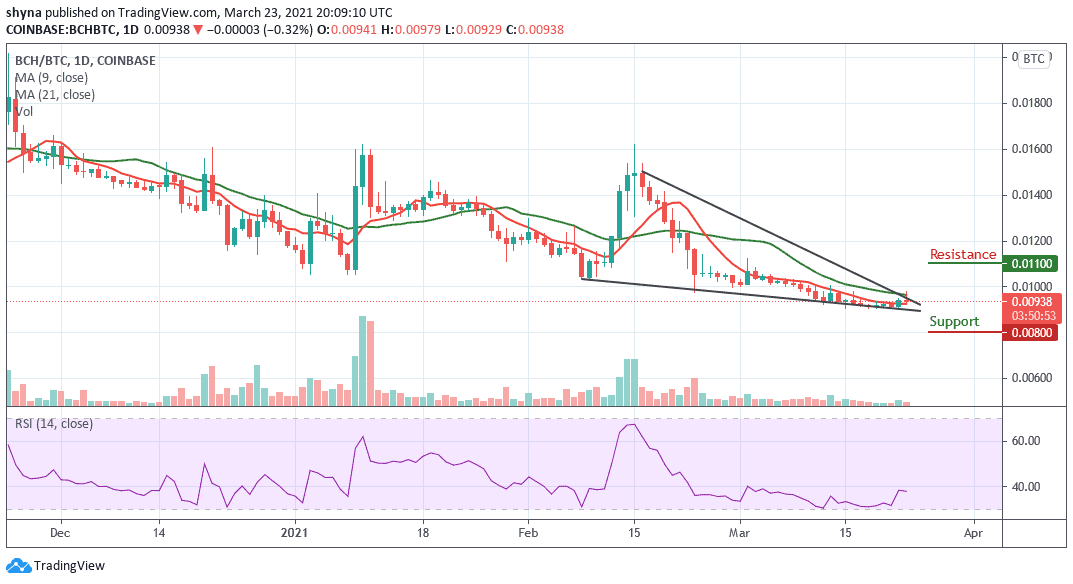
However, the only condition for the resumption of the bullish trend is if the 0.009 BTC level can continue to provide support for the market, then the price may be pushed to the resistance level of 0.011 BTC and above. Meanwhile, the BCH/BTC pair may continue to follow the sideways movement.
Join Our Telegram channel to stay up to date on breaking news coverage