Join Our Telegram channel to stay up to date on breaking news coverage
BCH Price Prediction – March 5
Bitcoin Cash struggles to stay above $500 as bears call for $480. The coin is likely to settle in consolidation around $450 for the short term.
BCH/USD Market
Key Levels:
Resistance levels: $650, $7, $410
Support levels: $195, $175, $155
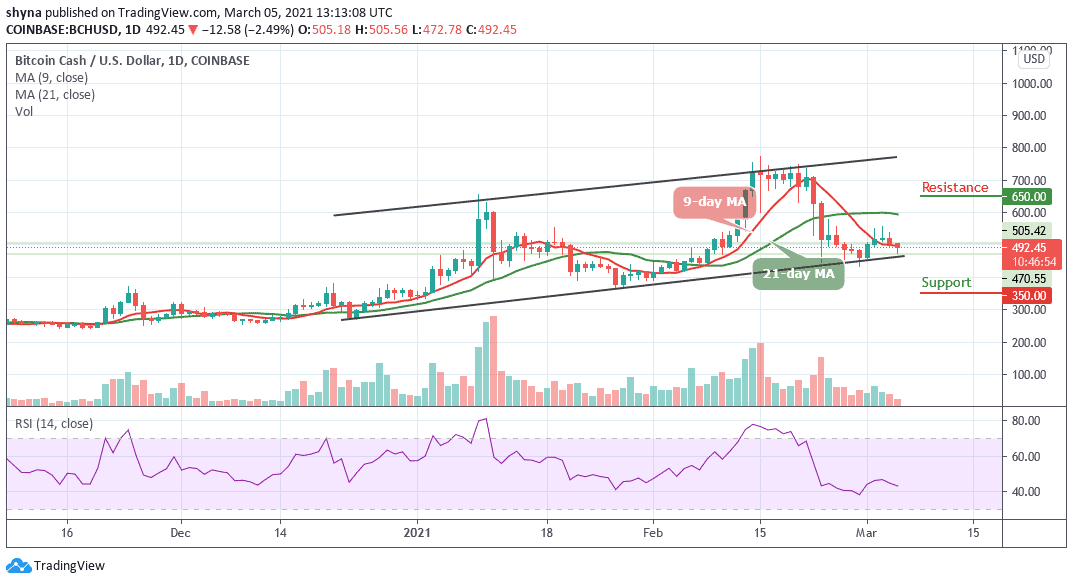
BCH/USD is pushing for consolidation below the moving averages as the trend has a bearish inclination, which may likely test the support at $470 as it moves towards the lower boundary of the channel. More so, the technical indicator has remained bearish as the RSI (14) continues to dig deeper below the 45-level.
What is the Next Direction for Bitcoin Cash?
According to the daily chart, the best the bulls can do is defending the support at $470 and focus on pulling towards $400. However, BCH/USD is making an effort to jump above the 9-day moving average as it is looking forward to reclaiming the ground past $500. The coin is already at the negative side and therefore a reflex bullish action is expected to correct the declines with a possible jump above the moving averages.
Meanwhile, if there is an increase in buying pressure, BCH/USD may follow the bullish movement to reach the $600 resistance. While trading at that level, a bullish continuation could reach the resistance levels of $650, $700, and $750 respectively. In other words, a minimum swing may likely push the market below the channel, and exceeding this level could take the bears to $350, $300, and $250 support levels.
Against BTC, following the recent negative sign, the Bitcoin Cash may continue to follow the downtrend in as much as the sellers keep the price below the 9-day and 21-day moving averages.
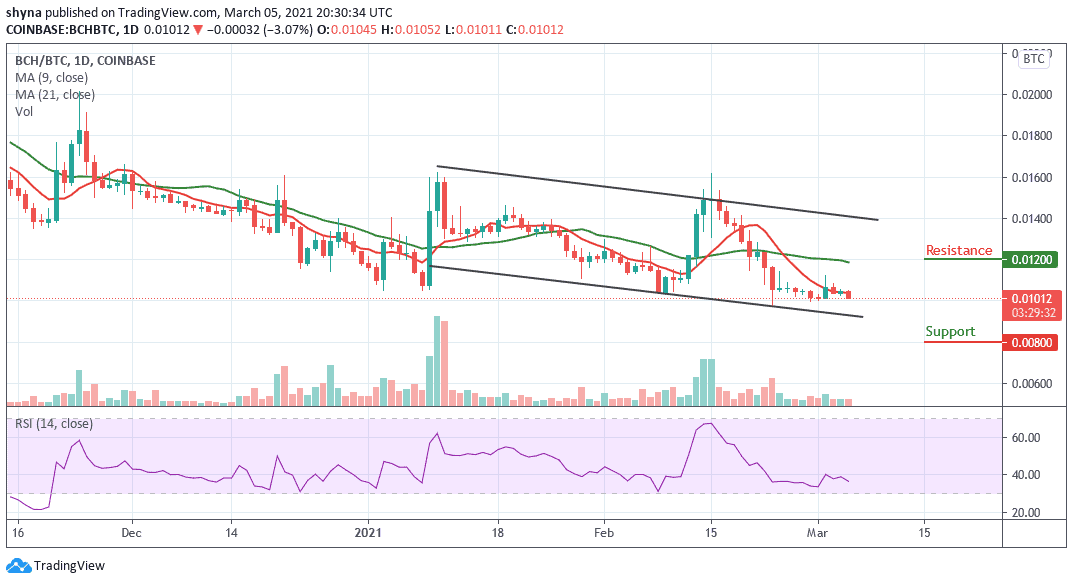
However, as the technical indicator RSI (14) hovering below the 40-level and once it moves into the oversold region, the market price may likely cross below the lower boundary of the channel to hit the support level of 0.008 BTC and 0.007 BTC but a bullish movement above the moving averages could push the price to the resistance level of 0.012 BTC and 0.013 BTC.
Join Our Telegram channel to stay up to date on breaking news coverage