Join Our Telegram channel to stay up to date on breaking news coverage
BCH Price Analysis – January 25
BCH/USD is following a bullish movement while the sellers are waiting to scalp gains from potential pullbacks.
BCH/USD Market
Key Levels:
Resistance levels: $550, $570, $590
Support levels: $350, $230, $210
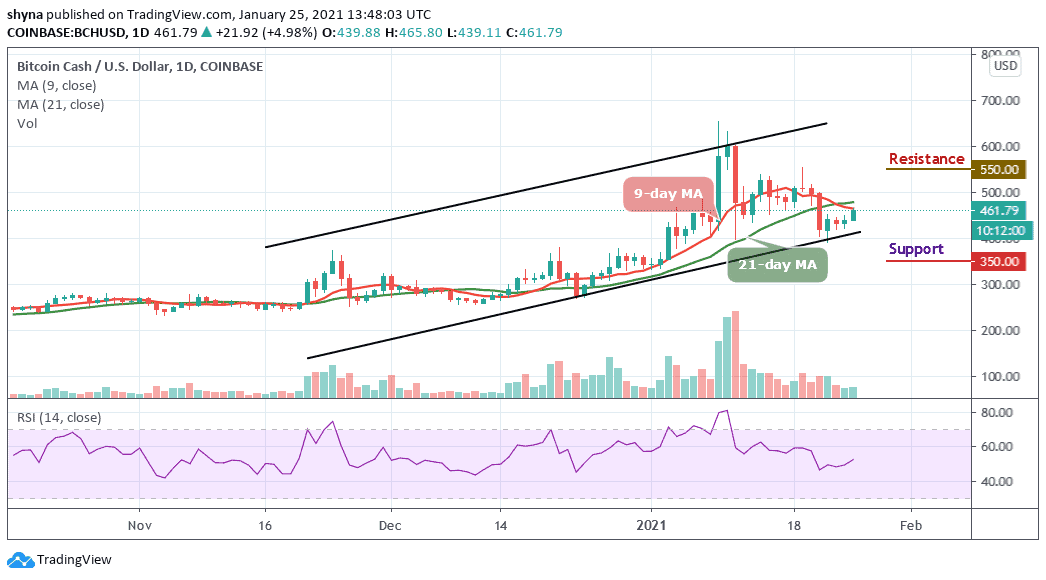
BCH/USD starts following the bullish movement since the beginning of trading today. Over the last few days, Bitcoin Cash has already started trending in an upward channel pattern and will look to gain momentum after bouncing up from the upward trending line. However, despite all this, the technical indicator RSI (14) is hovering above 50-level, as BCH/USD goes through a higher high.
What to Expect from Bitcoin Cash (BCH)
Looking at the daily chart, BCH/USD is changing hands at $461.79 and if the market price moves further, the coin could spike above the 9-day and 21-day moving averages which may likely reach the resistance levels of $550, $570, and $590, this can also cause the price to cross above the upper boundary of the channel. More so, a strong buying pressure may continue to push the price to the resistance level of $500.
However, while trading at $4610, a bearish movement may likely drag the price to the support levels of $350, $330, and $310. Meanwhile, the RSI (14) technical indicator is facing the south, indicating that more bullish movement may come to focus.
Against BTC, when looking at the daily chart, following the trade for the past few days, the market has been following sideways movement. More so, by following the recent market movement, the coin may continue to range-bound if the price remains within the 9-day and 21-day moving averages.
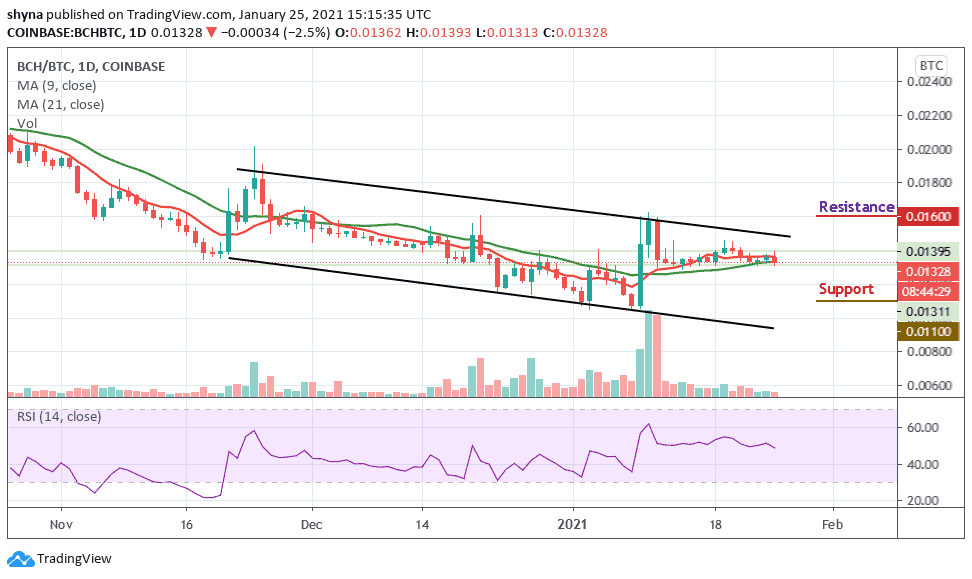
However, should in case the bulls push the price above the moving averages, the market price may likely cross above the upper boundary of the channel to reach the potential resistance level of 1600 SAT and 1700 SAT. In other words, a continuous bearish movement could allow the pair to go below the moving averages and lower the price to the support levels of 1100 SAT and 1000 SAT. In addition, the RSI (14) is seen moving below 50-level, suggesting additional bearish signals.
Join Our Telegram channel to stay up to date on breaking news coverage