Join Our Telegram channel to stay up to date on breaking news coverage
BCH Price Prediction – December 28
BCH/USD is in the hands of the buyers as confidence in the bullish market mounts. The market price is expected to move higher in 2021 if the recovery continues.
BCH/USD Market
Key Levels:
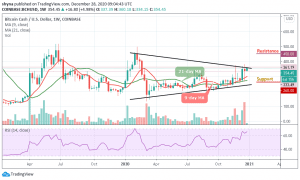
Resistance levels: $450, $500, $550
Support levels: $260, $210, $160

BCH/USD bulls are intentional in their push for gains above the 9-day and 21-day moving averages following a sharp slump to the support at $268 yesterday. However, this weekly chart reveals that buyers may have to work a little harder in the coming year 2021 to maintain the momentum towards $500.
Would Bitcoin Cash Go Up or Down in 2021?
BCH/USD started the year 2020 with $222 and in February there was a bearish breakout after the coin touches the yearly high of $497 which extends to the yearly low of $133 price level but the level withstands the bears’ pressure and the price decrease was terminated. The past few weeks mark the beginning of a good mood for the bulls. A bullish candle pattern was formed and the price started increasing.
However, BCH/USD is holding at $354 which is the prevailing market value. According to the technical indicator RSI (14), Bitcoin Cash has potential for gains towards $450, $500, and $550 resistance levels. Moreover, a confirmed breakout above the channel may aid in determining the bullish strength. In this case, consolidation could take precedence with Bitcoin Cash settling onto the short term support at $300. Any bearish movement could lead to the critical supports at $260, $210, and $160.
When compares with Bitcoin, Bitcoin Cash has been following the downtrend since February 2020. The sellers continued to gain control of the market as the price remains below the 9-day and 21-day moving averages within the channel while the technical indicator RSI (14) moves within the oversold region. BCH/BTC may remain at the downside if the bulls failed to push it above the moving averages in the coming year 2021.

Moreover, the weekly chart reveals that the sellers have more confidence to increase their entries, and if the bears succeeded in breaking the price more in 2021, the market may fall to the support level of 0.0070 BTC and below. Meanwhile, a rebound could push it above the moving averages and increase it to the resistance level of 0.0200 BTC and above.
Join Our Telegram channel to stay up to date on breaking news coverage
