Join Our Telegram channel to stay up to date on breaking news coverage
BCH Price Prediction – December 12
The BCH bulls are showing commitment as the market approaches the $250 resistance on a recovery move.
BCH/USD Market
Key Levels:
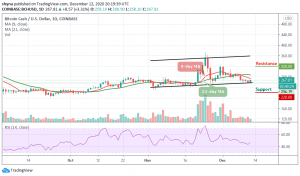
Resistance levels: $320, $340, $360
Support levels: $220, $200, $180

BCH/USD is seen on a recovery mode as the coin moves toward the 9-day and 21-day moving averages, as the weekend love for the cryptocurrencies seems to have returned. After two consecutive bearish days, the coin is now trading around the $267 level, gaining 3.31% within 24 hours.
Where is BCH Price Going Next?
The price of Bitcoin Cash now remains below the moving averages within the channel. Meanwhile, several supports have been useful, including the upward trend line and the lower boundary of the channel at $256. Despite all these, the price action during the trading hours has been relatively bullish following the channel formation. The technical indicator RSI (14) signals a bullish step back to show that the buyers could be in control of the market and the coin may likely reach the potential resistance levels at $320, $340, and $360.
However, by observing the movement of the coin, the Bitcoin Cash has been showing an uneven movement with several rises and falls for a few days. The traders will discover that the coin has not been able to maintain a consistent bullish run. Therefore, it is likely the market may start showing some signs of a downward movement slowly in the next few days and the critical supports are located at $220, $200, and $180 respectively.
Against Bitcoin, BCH is still following the downtrend trading below the 9-day and 21-day moving averages. The daily chart reveals that there’s a low amount of selling pressure in the market. The technical indicator RSI (14) confirms the movement of the coin as the signal line keeps moving below the 40-level.
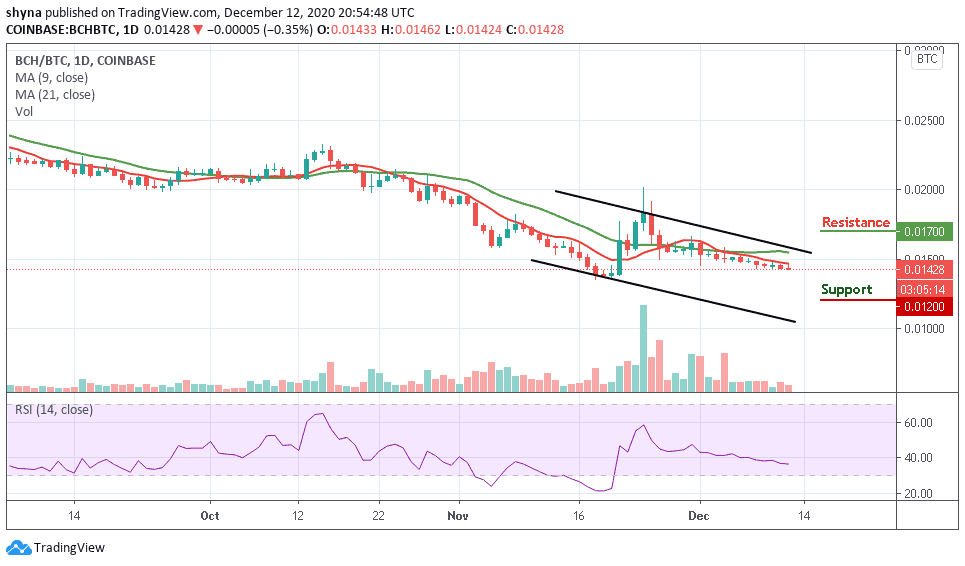
However, bulls are waiting for a break above the moving averages to touch the nearest resistance level of 0.016 BTC. Moreover, if the bulls fail to push the market upward; it could easily fall to 0.031 BTC support and a bearish continuation may touch the 0.012 BTC and below.
Join Our Telegram channel to stay up to date on breaking news coverage