Join Our Telegram channel to stay up to date on breaking news coverage
The Bancor price prediction reveals that the BNT price is crossing above the 9-day and 21-day moving averages to begin the upward movement.
Bancor Prediction Statistics Data:
- Bancor price now – $0.44
- Bancor market cap – $61.8 million
- Bancor circulating supply – 144.9 million
- Bancor total supply – 161.1 million
- Bancor Coinmarketcap ranking – #313
BNT/USD Market
Key Levels:
Resistance levels: $0.60, $0.65, $0.70
Support levels: $0.25, $0.20, $0.15
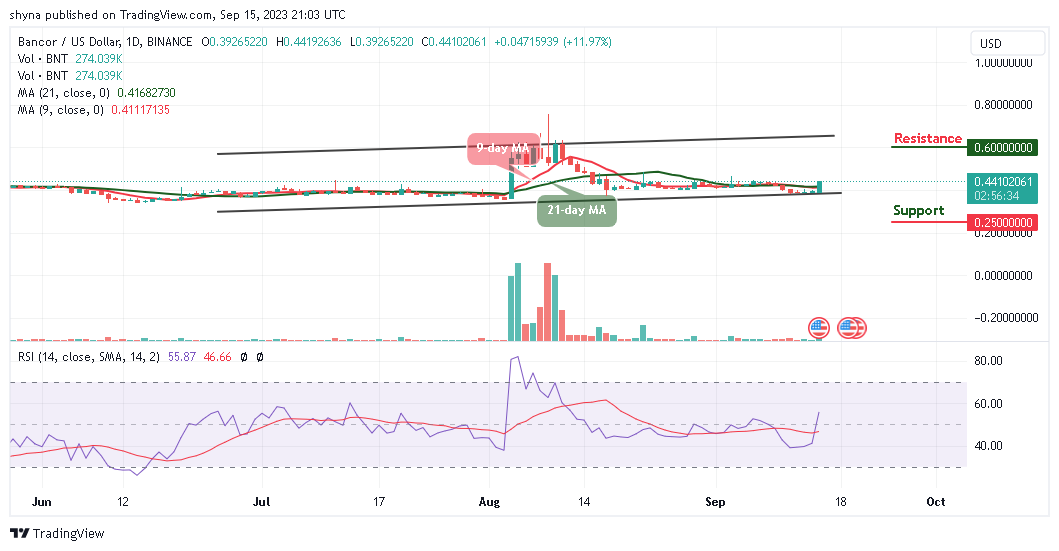
BNT/USD is currently exchanging hands at $0.44 as the coin crosses above the 9-day and 21-day moving averages. The BNT price could head toward the upper boundary of the channel if the bulls increase the buying pressure. However, Bancor (BNT) will have to focus on the bullish movement to guide against the downward pressure while the closest support expects the coin at $0.35, which could be the daily low.
Bancor Price Prediction: Bancor (BNT) May Gain More Uptrends
The Bancor price regains back above the 9-day and 21-day moving averages because any bearish movement below the lower boundary of the channel could bring the coin to the support levels of $0.25, $0.20, and $0.15. However, BNT/USD is trading at $0.44 and still trading above the moving averages. On the upside, a sustained move above this barrier to face the upper boundary of the channel could create more strength for the bulls with the focus on moving the market to the next resistance levels of $0.60, $0.65, and $0.70 respectively.
At the moment, the technical indicator Relative Strength Index (14) moves to cross above the 60-level, which indicates that the market may follow the upward movement. Looking at the daily chart, there may be a need for support to be formed around $0.40 to provide tight protection which could allow the buyers to concentrate on stirring action to the north.
BNT/BTC Grows 13.22% as Price Hits 1682 SAT
Against Bitcoin, the Bancor price is hovering above the 9-day and 21-day moving averages but if the sellers move to bring the price to the downside, it could fall below the lower boundary of the channel, while the technical indicator Relative Strength Index (14) moves to cross above the 60-level.
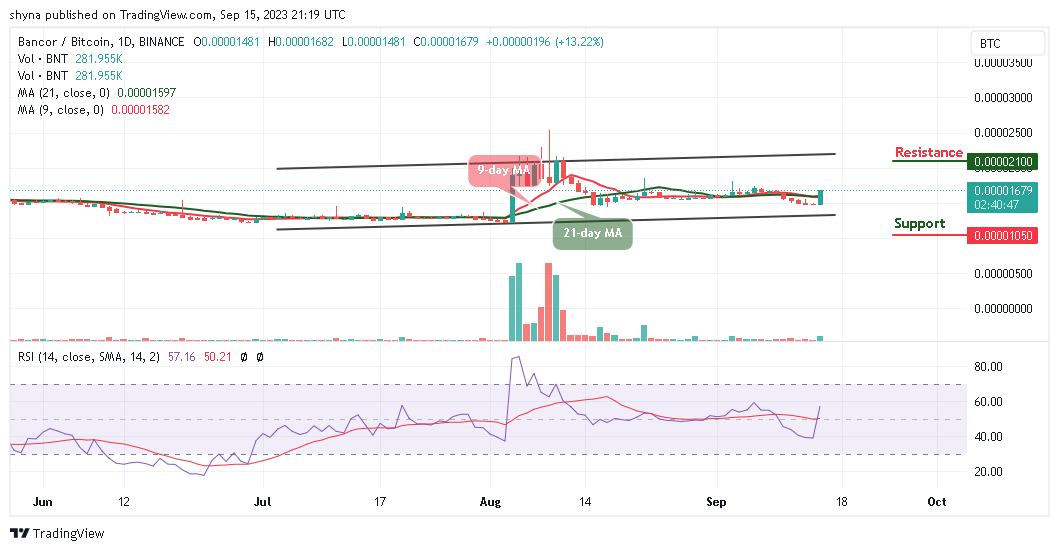
However, if the bulls succeed in breaking toward the upper boundary of the channel, the BNT price may hit the potential resistance level at 2100 SAT and above. On the contrary, the coming back of the bearish movement could bring the price to the support level of 1050 SAT and below.
Alternatives to Bancor
The Bancor price, according to the daily chart is hovering at $0.44 so it couldn’t take more days for it to catch up above the $0.50 resistance level. However, the Bancor price has not seen any major pullbacks yet but may use the lower boundary of the channel for support if it happens. Meanwhile, the most important signal for Bancor is the break of $0.50, which represented a major resistance level.
In light of recent developments, as various prominent tokens see a decline, the Wall Street Memes token stands out with its “buy” recommendation, thanks to its impressively affordable presale rate, which has already yielded more than $25 million in profits. Don’t overlook the chance to acquire tokens at their current price before they witness a significant surge.
CoinCodex - Our Recommended Crypto Research Platform

- Live Cryptocurrency Prices for Over 20,000 Coins
- Crypto Price Analysis with Popular Technical Indicators
- Crypto Price Predictions with Short and Long-Term Charts
- Historical Crypto Market Data Dating to 2010
- Crypto Portfolio, Profit Calculator, and Other Investment Tools
Join Our Telegram channel to stay up to date on breaking news coverage