Join Our Telegram channel to stay up to date on breaking news coverage
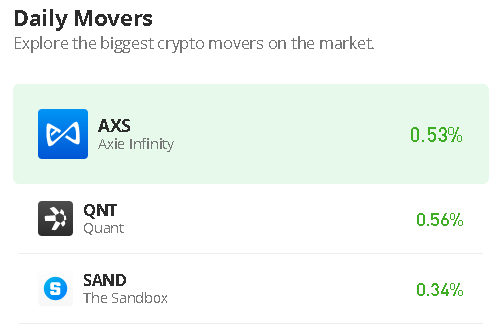
The Axie Infinity price prediction shows that AXS is recovering from the daily low at the $6.52 level as the price gets ready for the upside.
Axie Infinity Prediction Statistics Data:
- Axie Infinity price now – $6.83
- Axie Infinity market cap – $792.3 million
- Axie Infinity circulating supply – 116.5 million
- Axie Infinity total supply – 270 million
- Axie Infinity Coinmarketcap ranking – #56
AXS/USD Market
Key Levels:
Resistance levels: $9.80, $10.00, $10.20
Support levels: $4.70, $4.50, $4.30
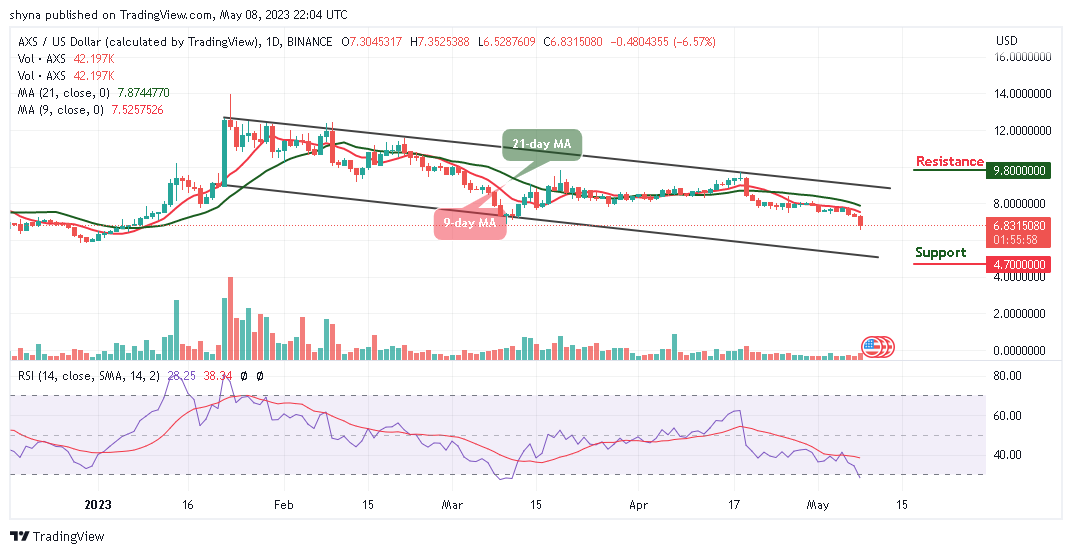
AXS/USD is reversing toward the 9-day and 21-day moving averages after touching the daily low at the $6.52 support level. At the time of writing, Axie Infinity is hovering at $6.83, trading below the moving averages. However, with latest the recovery, the coin is likely to trade bullishly if the bulls return to the market.
Axie Infinity Price Prediction: Can AXS Break Above $7.0?
The Axie Infinity price stays below the 9-day and 21-day moving averages, if the crosses above this barrier, AXS/USD may likely touch the resistance levels of $9.80, $10.00, and $10.20. Nevertheless, any further strong selling pressure below the 9-day and 21-day moving averages could drag the price toward the lower boundary of the channel if the bears increase the selling pressure.
However, should in case Axie Infinity stay below the moving averages, a bearish continuation could bring the price to the supports of $4.70, $4.50, and $4.30. Meanwhile, the technical indicator Relative Strength Index (14) is likely to cross below the 30-level, indicating a bearish movement.
Against Bitcoin, the Axie Infinity price could slide below the lower boundary of the channel according to the chart. However, if the coin follows the positive sign, the market movement may head to the upside if the buyers push the price toward the upper boundary of the channel.
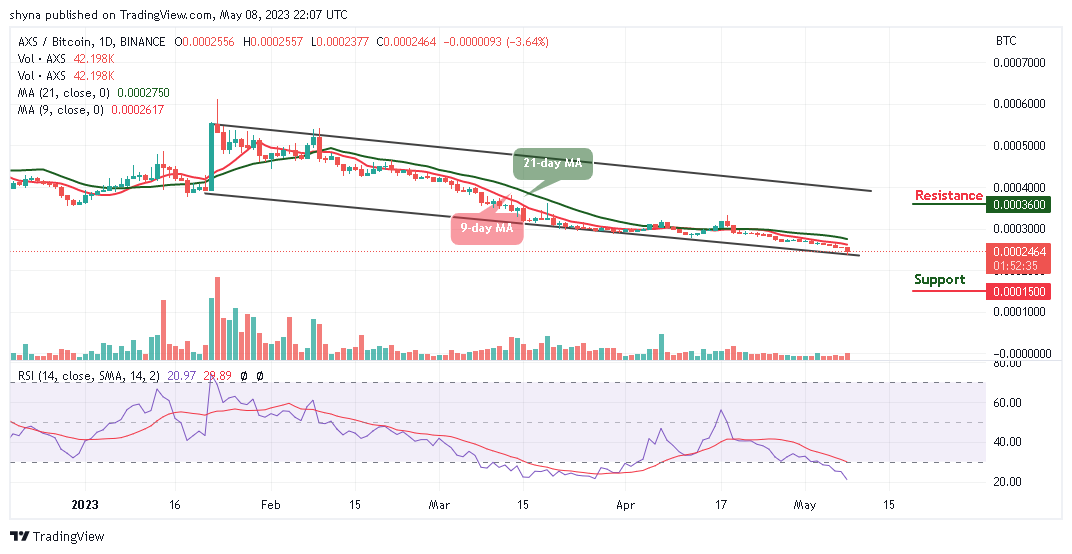
Moreover, as the technical indicator, Relative Strength Index (14) remains within the oversold region, once it crosses above the 30-level, the market price could spike toward the upper boundary of the channel to hit the resistance level of 3600 SAT and above. Meanwhile, a bearish cross below the channel could lower the price to the support level of 1500 SAT and below.
Axie Infinity Alternatives
The Axie Infinity may face the upside if the red line of the 9-day MA crosses above the green line of the 21-day MA. At the time of writing, the movement is likely to shift back into the bullish favor if the technical indicator Relative Strength Index (14) returns to the positive side. Moreover, AI is the future of memes and its ecosystem offers users the opportunity to stake $AI tokens to earn daily credit rewards and access platform features. Staking is crucial for long-term engagement and platform stability. The public wall is a dynamic space within AiDoge where users view and share AI-generated memes. Meanwhile, the token has raised almost $4m in the ongoing presale.
CoinCodex - Our Recommended Crypto Research Platform

- Live Cryptocurrency Prices for Over 20,000 Coins
- Crypto Price Analysis with Popular Technical Indicators
- Crypto Price Predictions with Short and Long-Term Charts
- Historical Crypto Market Data Dating to 2010
- Crypto Portfolio, Profit Calculator, and Other Investment Tools
Join Our Telegram channel to stay up to date on breaking news coverage