Join Our Telegram channel to stay up to date on breaking news coverage
AUDUSD Price Analysis – July 22
After the pullback, the price of AUDUSD may increase further to test the supply level of $0.711. In case the Bears double their momentum, the price may drop to $0.701 – $0.692.
AUD/USD Market
Key levels:
Supply levels: $0.711, $0.722, $0.738
Demand levels: $0.701, $0.692, $0.682
AUDUSD Long-term trend: Bullish
AUDUSD is bullish on the daily chart. AUDUSD was bullish last week. The breakout that took place on July 15 at the former supply level of $0.701 shows that the momentum of the Bulls is strong in the AUDUSD market. There was a price retracement on July 16 – 17. The Bulls resumed their activities after the pullback; this was noticed with the formation of a strong bullish candle on July 18. The Bears dominate the market today, the price pulls back towards the $0.701.
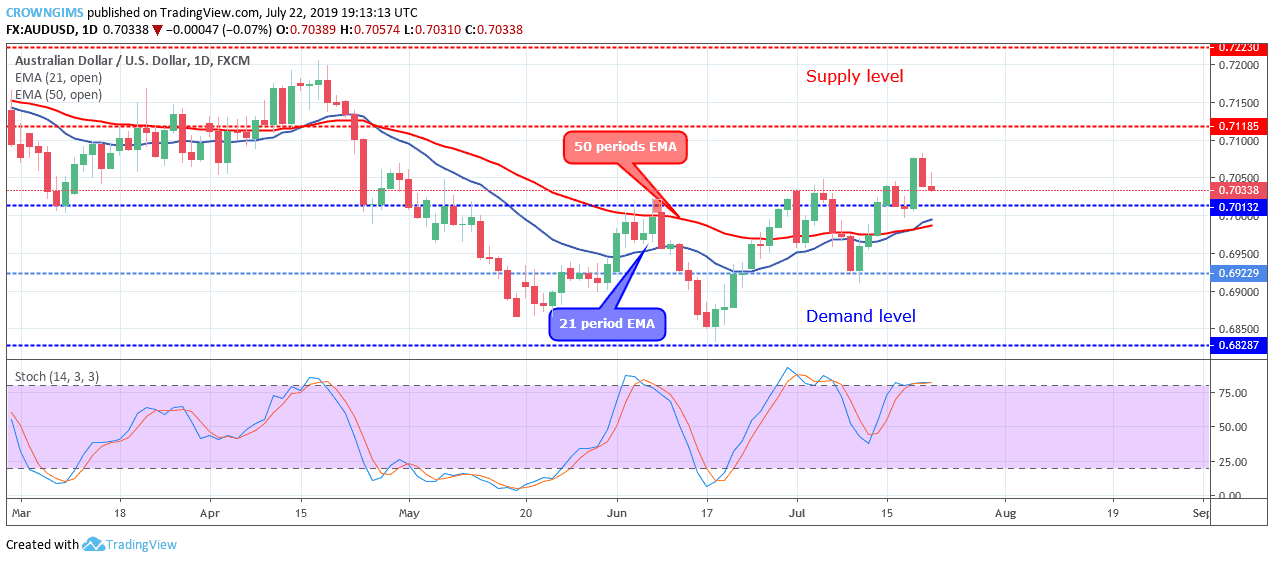
The Stochastic Oscillator period 14 is at 80 levels with the signal lines interlocked to each other showing no direction. The 21 periods EMA has crossed 50 periods EMA upside as a sign of the bullish trend, the price is trading above the two EMAs. After the pullback, the price of AUDUSD may increase further to test the supply level of $0.711. In case the Bears double their momentum, the price may drop to $0.701 – $0.692.
AUDUSD medium-term Trend: Bullish
AUDUSD is bullish in the medium-term outlook. The bullish momentum broke up the dynamic support and resistance level together with the $0.701 former supply level. The price pulled back to retest the broken level which is the normal phenomenon in a trending market. Today, the pair pulled back to touch the two EMAs and started consolidating.
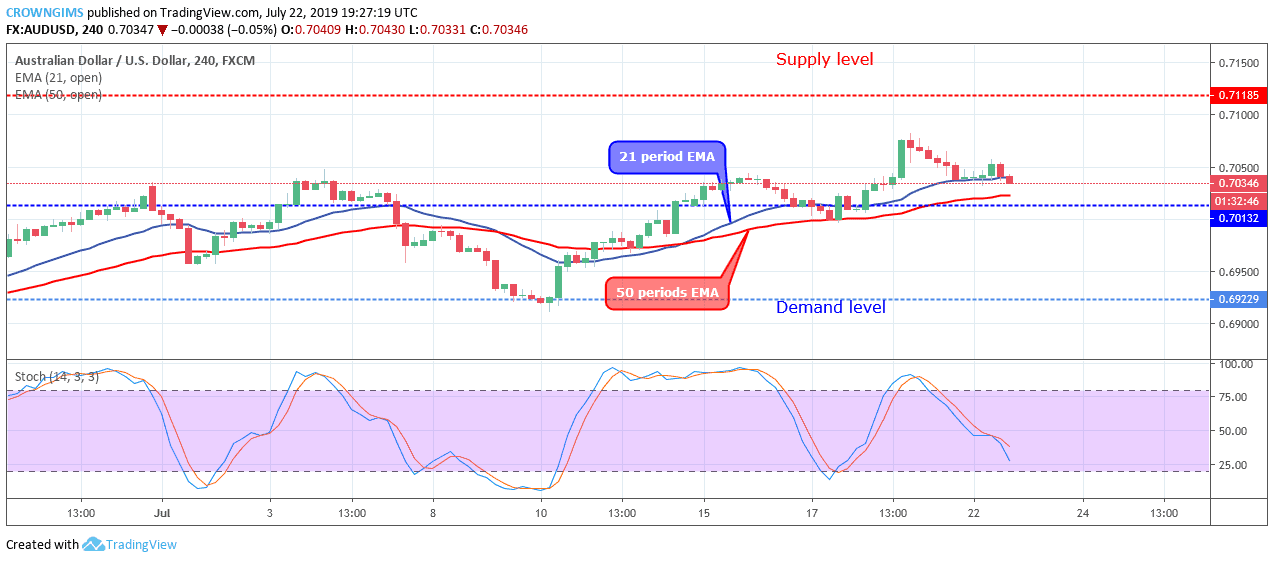
The price is crossing below the 21 periods EMA and 50 periods EMA, meanwhile, the Stochastic Oscillator period 14 is above 25 levels with the signal lines pointing down which indicates a sell signal.
Please note: insidebitcoins.com is not a financial advisor. Do your own research before investing your funds in any financial asset or presented product or event. We are not responsible for your investing results.
Join Our Telegram channel to stay up to date on breaking news coverage