
Join Our Telegram channel to stay up to date on breaking news coverage
AUDUSD Price Analysis – June 04
Should the Bears exert more pressure, further declination in price is certain and the currency pair may target $0.680 level. In case the Bulls prevailed over the Bears at the $0.692 level, the price may target $0.701 price level.
AUD/USD Market
Key levels:
Supply levels: $0.701, $0.711, $0.722
Demand levels: $0.692, $0.680, $0.670
AUDUSD Long-term trend: Bearish
AUDUSD is bearish on the daily chart. After the pullback observed by the currency pair to $0.692 level last week, the price started consolidating at the level for four days. Nevertheless, last week market closed with a daily bullish candle that broke up the demand level of $0.692. On June 03, another strong bullish candle emerged that penetrated the 21 period EMA but yet to penetrate 50 periods EMA. The AUDUSD price is moving towards $0.701 level.
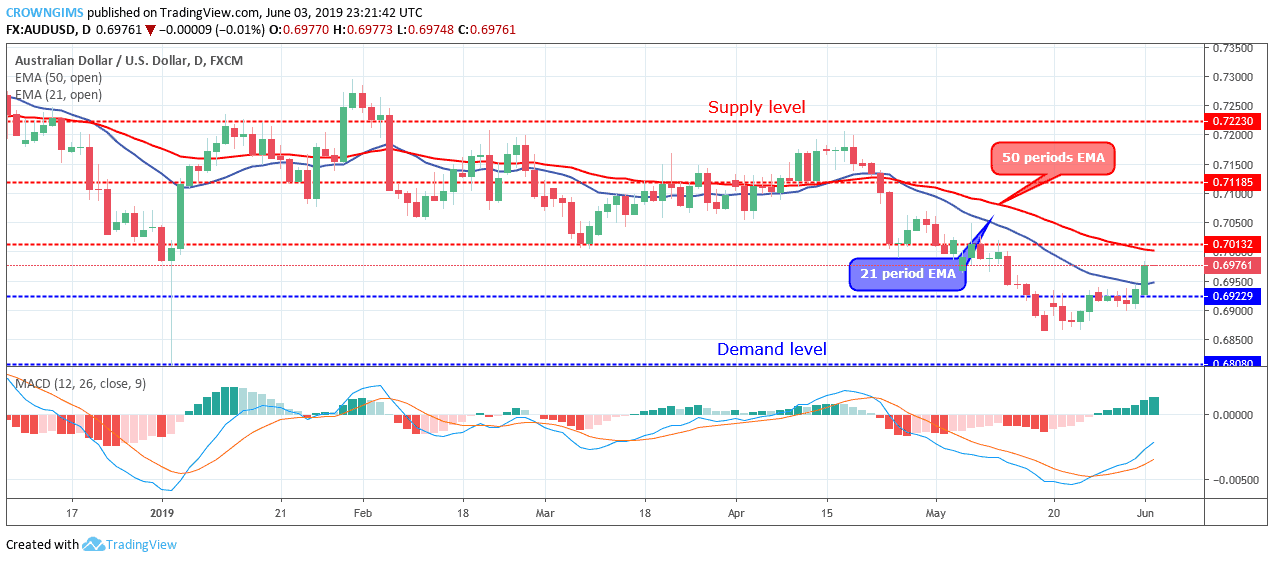
AUDUSD is trading in between the 21 periods EMA and 50 periods EMA with the aim of the buyers to push the price above $0.701 level. The Moving Average Convergence Divergence period 12 with its histogram is above zero level and the signal line crossed MACD line up side to connote buy signal. More pressure from the Buyers will push up the price to break up the $0.701 level and the price may be targeting $0.711 level. In case the Bears defend the $0.701 level, the price may range back to $0.692 level.
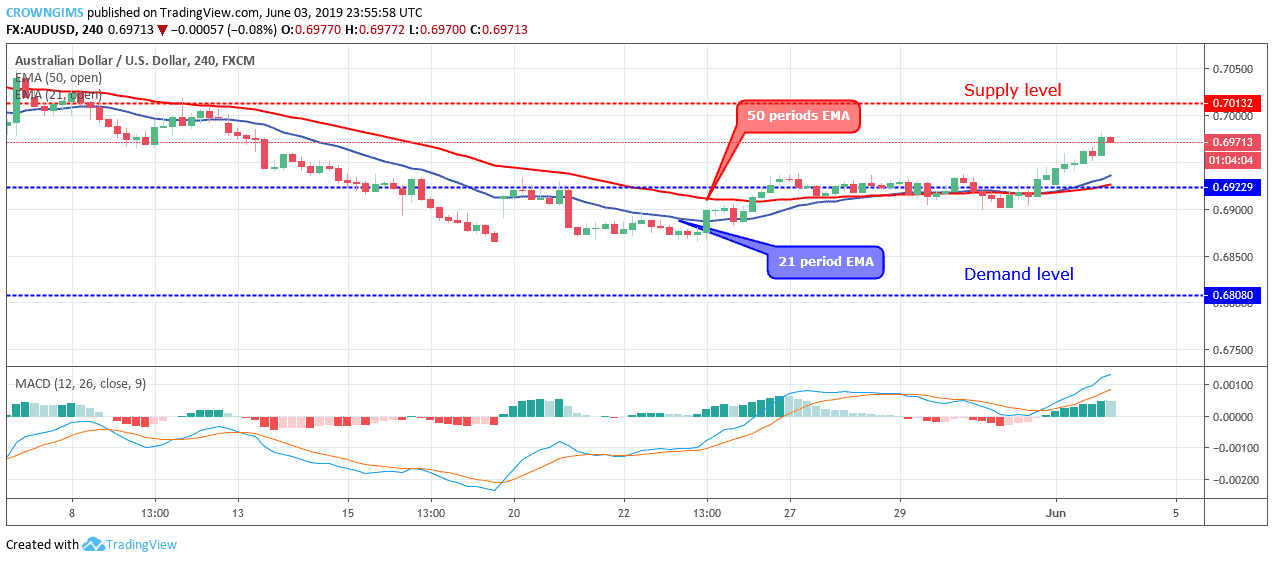
AUDUSD medium-term Trend: Bullish
The Bulls have taken over AUDUSD market in the medium-term outlook. The Bulls eventually prevailed over the Bears during the consolidation scenario that took place last week on the 4-hour chart. On May 31, the bulls gained pressure and a bullish candle emerged and broke up at $0.692 level. The price is currently moving towards $0.701 price level.

The currency pair is trading above the 21 periods EMA and 50 periods EMA with the two EMAs gradually separating from each other. The histogram of MACD period 12 is above zero level and the signal line pointing upside to indicate a buy signal.
Please note: insidebitcoins.com is not a financial advisor. Do your own research before investing your funds in any financial asset or presented product or event. We are not responsible for your investing results.
Join Our Telegram channel to stay up to date on breaking news coverage