Join Our Telegram channel to stay up to date on breaking news coverage
What will be the future of APT’s price amidst the tensions between Aptos and Sui? The recent disinvitation of Sui representatives from Aptos’ MoveCon conference highlights the competition between the two blockchain startups, both of which use the Move language that originated from Facebook’s Diem stablecoin project.
In this analysis, we’ll examine APT’s current price and indicators to determine its potential future direction.
Hey @Aptos_Network, I’m disappointed to learn that you pressured @PontemNetwork into removing @tnowacki + @damirka + Shayan Sanjideh as speakers at https://t.co/OBoVoDglEI, as well eliminating Sui Foundation from the organizations participating in this community-organized event. pic.twitter.com/MxUnvr6URS
— Sam Blackshear (@b1ackd0g) February 28, 2023
From today to Sunday, Pontem—a crypto wallet startup backed by the Aptos Foundation—is hosting MoveCon at the sidelines of ETHDenver. The conference is centered around the Move programming language.
Initially, Pontem team members had promised that the conference was “dedicated” to the Move space in general—extending invitations to Sui representatives.
However, according to those knowledgeable with the matter and some tweets—Pontem ultimately rescinded these invites for Sui Foundation attendees at the behest of Aptos officials; although a few Sui project founders are already confirmed as speakers.
The Sui Foundation is committed to an open, welcoming and inclusive culture to help advance the decentralized future. We strongly believe the Move programming language and its ecosystem benefit from having a broad and cross-platform community. https://t.co/s3maOgrT1M
— Brian HH (@bhenhsi) February 28, 2023
Sam Blackshear, Sui CTO, criticized Aptos in a tweet about the disinvitation. The move has exposed the competition between the two startups, with both vying for recognition in the crypto industry.
The disinvitation of Sui representatives suggests that Aptos is becoming focused on promoting its own blockchain interests above the ideals of collaboration within the industry.
If tensions between Aptos and Sui continue to escalate and Aptos fails to collaborate with others in the space, this could have a negative effect on the APT price in the long term.
Considering these recent developments, we turn to technical analysis of APT’s price to get an idea for its future direction.
APT Price Analysis
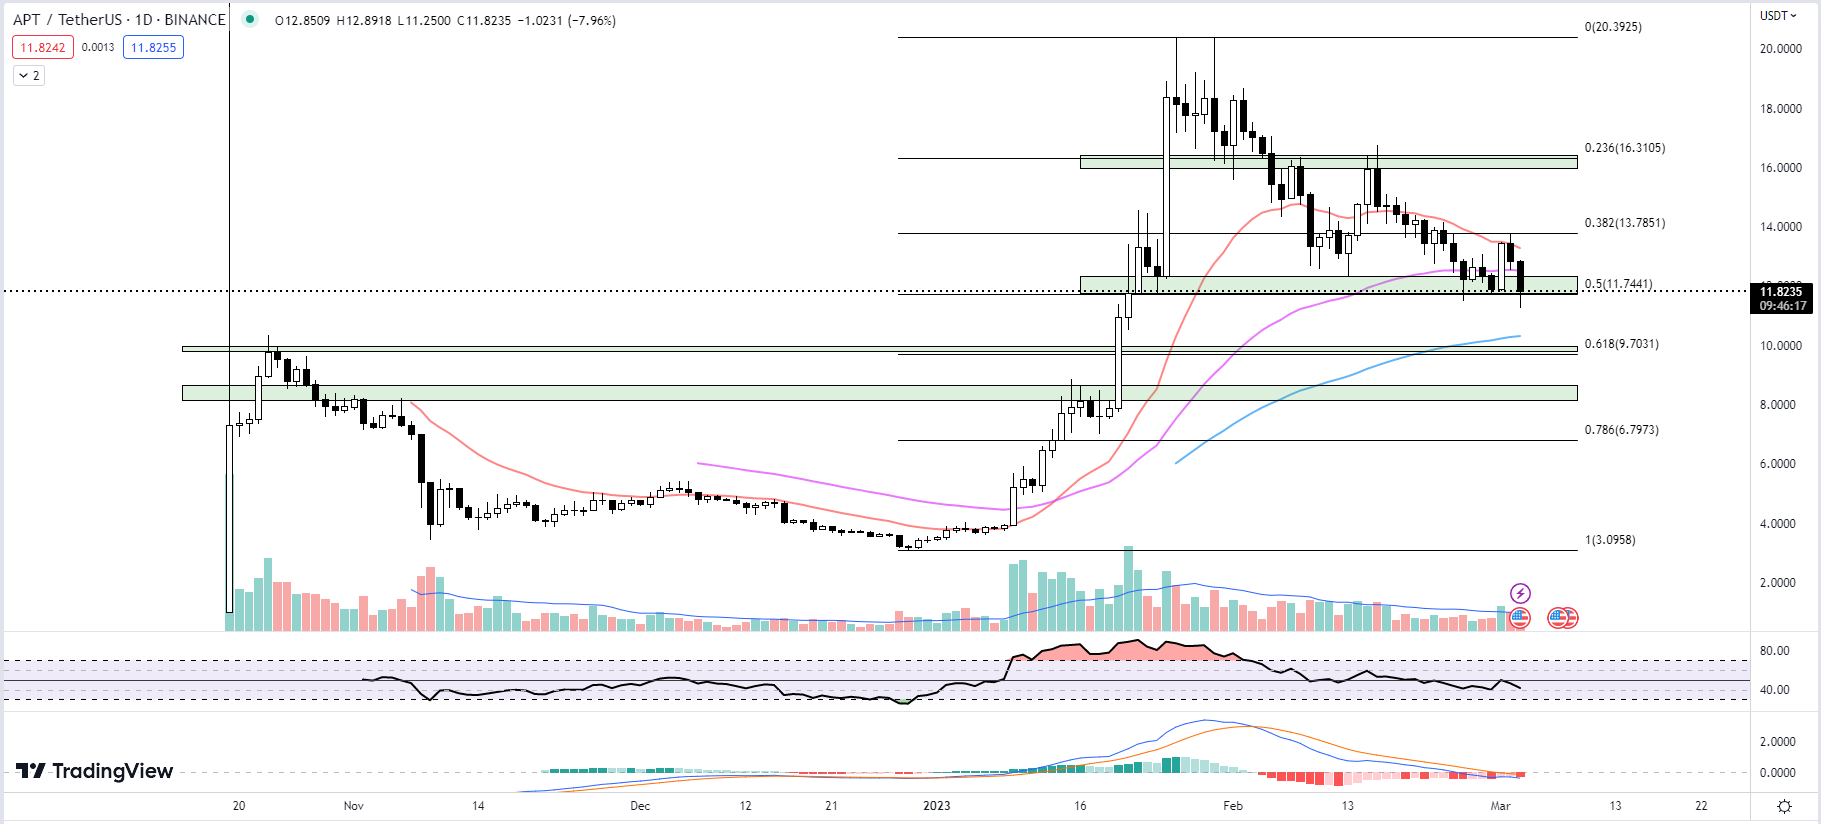
Aptos (APT) token’s price is showing signs of a continued bearish sentiment as the wider crypto market selloff continues. APT is currently trading at Fib 0.50, indicating a 50% retracement in its 2023 run so far.
With Bitcoin and other cryptocurrencies attempting to find their footing for possible support, APT’s price may potentially be heading lower if the rest of the market fails to stabilize.
APT Price January Rally and Technical Indicators
In January, APT experienced a buying volume surge, rallying around 330% in a short time before market sentiment turned mildly bearish, and the rally halted at $20. After some consolidation, APT traders began profit booking, causing prices to head downward.
The crypto market has experienced a bearish sentiment over the past few days, with Aptos (APT) token’s price dropping so far today by 7% to its current price of $11.73. Let’s take a look at some technical indicators for APT to determine where the price could potentially head in the coming days.
Exponential Moving Averages (EMA)
APT’s 20-day EMA is currently at $13.278, indicating a bearish short-term trend. Meanwhile, the 50-day EMA is at $12.516 and the 100-day EMA is at $10.309. The current price of APT is below both the short-term (20-day) and medium-term (50-day) EMAs, which may act as resistance levels.
Relative Strength Index (RSI) Influence on APT Price
APT’s RSI is currently at 41.73, suggesting that the token is neither overbought nor oversold. The RSI has been trending downwards over the past few days, indicating a weakening bullish momentum.
Moving Average Convergence Divergence (MACD)
The MACD indicator shows that the previous day’s MACD histogram was at -0.2118, with the current day’s MACD histogram at -0.2350. The negative crossover indicates a bearish trend in the short term.
Volume
APT’s volume for the current day stands at 7.5M, lower than the previous day’s volume of 10.282M. The volume moving average for APT is at 7.41M, suggesting that the trading activity is decreasing.
Support and Resistance Levels for APT Price
The immediate resistance for the APT price is at Fib 0.382, located at $13.785. The immediate potential support level is at Fib 0.5, situated at $11.744, right at the token’s current price point. If the bearish trend continues and APT fails to hold this support, APT could reach the next support level at Fib 0.618, located at $9.70.
APT’s technical indicators suggest a bearish sentiment in the short-term, with the current price below the short and medium-term EMAs, and the MACD showing a negative crossover. The decreasing volume also indicates a decrease in trading activity.
Although the RSI is not yet oversold, it is trending downwards, indicating a weakening bullish momentum for the APT price. Trading activity for APT should be closely monitored at these levels before any positions are taken.
Related:
- US Senators Allege Binance for becoming a ‘hotbed’ of illegal activity
- Most Profitable Cryptos Around: TMS Network (TMSN), Fantom (FTM), and Filecoin (FIL)
- Biggest Crypto Gainers Today, March 3- PERL, CFX, FGHT, CCHG, METRO, TARO
Best Wallet - Diversify Your Crypto Portfolio
- Easy to Use, Feature-Driven Crypto Wallet
- Get Early Access to Upcoming Token ICOs
- Multi-Chain, Multi-Wallet, Non-Custodial
- Now On App Store, Google Play
- Stake To Earn Native Token $BEST
- 250,000+ Monthly Active Users
Join Our Telegram channel to stay up to date on breaking news coverage


